📝 Guest post: Prevent AI failure with data logging and ML monitoring*
Was this email forwarded to you? Sign up here Monitoring and observability for AI applications are on every organization’s roadmap right now. In this guest post, our partner WhyLabs highlights the need for data and machine learning-specific logging. They describe whylogs, the open-source standard for data logging, which enables monitoring and more in AI and data applications. You can dive directly into whylogs with the getting started example or read on to learn more.
First, what is data logging?Logs are an essential part of monitoring and observability for classic software applications. Logs enable you to diagnose what happened to an application, track changes over time, and debug issues that arise. When it comes to ML applications, however, it’s not enough to log the traditional software metrics such as uptime, bounce rate, and load time. Data behaves differently than code and necessitates collecting different signals from the application. That’s where data logging comes in. Data logs capture data quality, data drift, model performance, and other data-specific health signals. With data logs, you can monitor model performance and data drift, validate data quality, track data for ML experiments, and institute data auditing and governance best practices. But how can you implement data logs in practice? That’s where whylogs comes inThe team at WhyLabs built whylogs as the open-source standard for data logging to address all the logging needs of AI builders. With whylogs, the data flowing through AI and data applications gets continuously logged.
With whylogs, you can generate statistical summaries, whylogs profiles, from data as it flows through your data pipelines and into your machine learning models. With these statistical summaries, you can track changes in the data and model over time, picking up on issues like data drift or data quality degradation. Who uses whylogs?
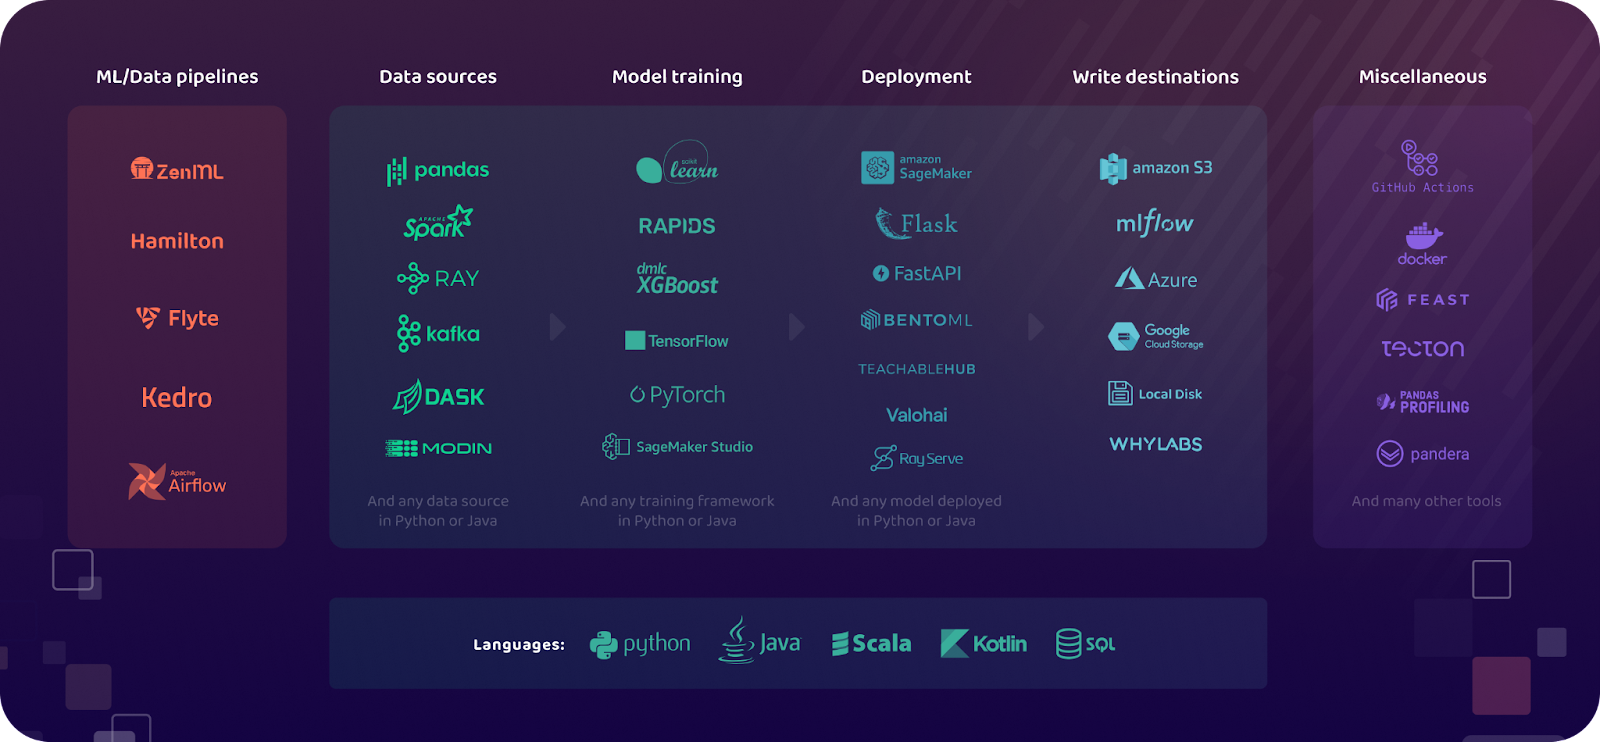
Today, whylogs is used by thousands of AI builders, from startups to Fortune 100 companies. Users solve for a wide variety of use cases, data types and model types. We designed whylogs in collaboration with data scientists, data engineers, and machine learning engineers across the ML community. The mission of whylogs is simple: create a platform-agnostic library that captures all key statistical properties of a dataset. By design, whylogs works natively with both streaming and batch data. It works out of the box on tabular, image, and text data, and can be extended to handle arbitrary data types, such as embeddings, audio, video, etc. The library runs natively in Python or Java environments, so it can be used with Pandas, Dask, Modin, Ray, Apache Spark, or many other data storage and processing tools. In fact, with over 35 integrations available today and more in progress, it’s safe to say that whylogs can work with whatever tool stack you’re using.
What can I use whylogs for?Setting up whylogs takes less time than brewing a cup of coffee. Simply
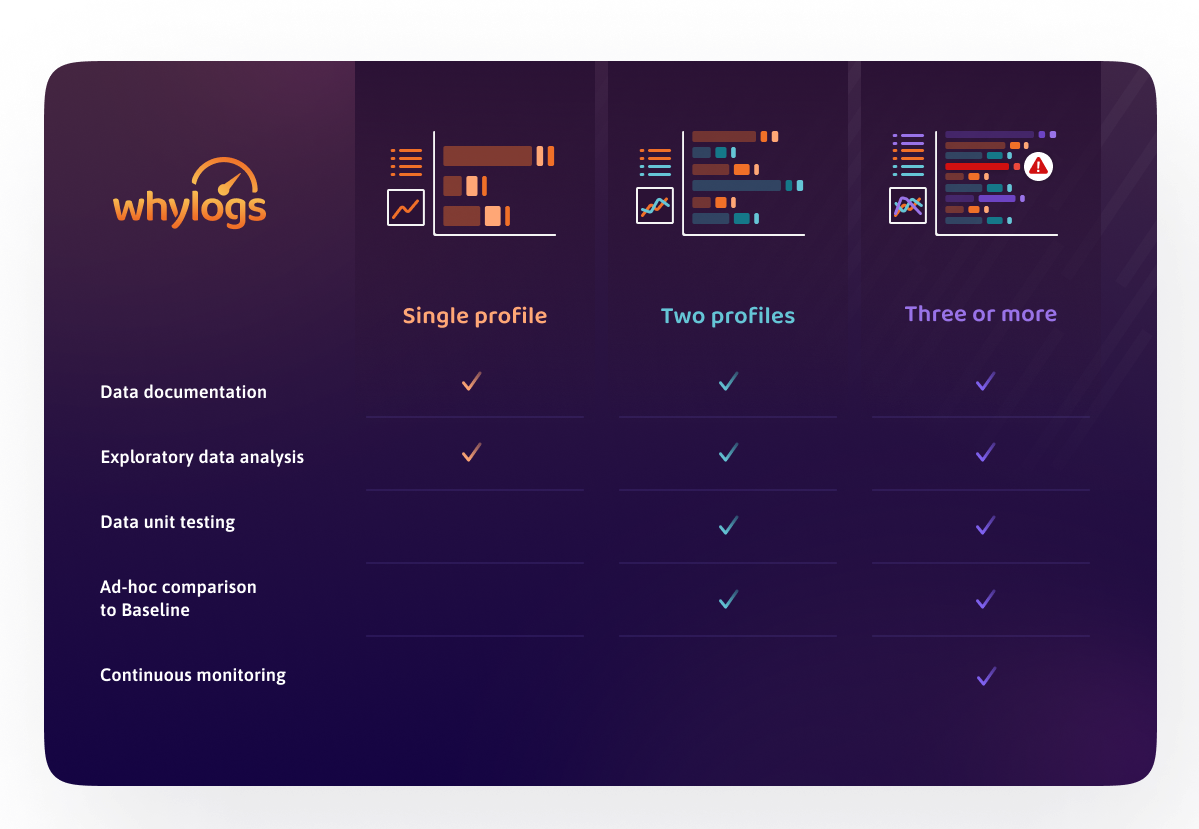
After generating a whylogs profile, you can:
These three functionalities unlock a variety of use cases for data scientists, data engineers, and machine learning engineers:
What’s new with whylogs v1?With the launch of whylogs v1, WhyLabs released a host of new features and functionalities, improving the library in four key development areas:
API SimplificationGenerating whylogs profiles takes a single line of code. Logging your data is as easy as running Data scientists and ML engineers will find it even easier to log data with the simplified API. This means higher data quality, more ML models reliably deployed in production, and more best practices followed. Profile Constraints
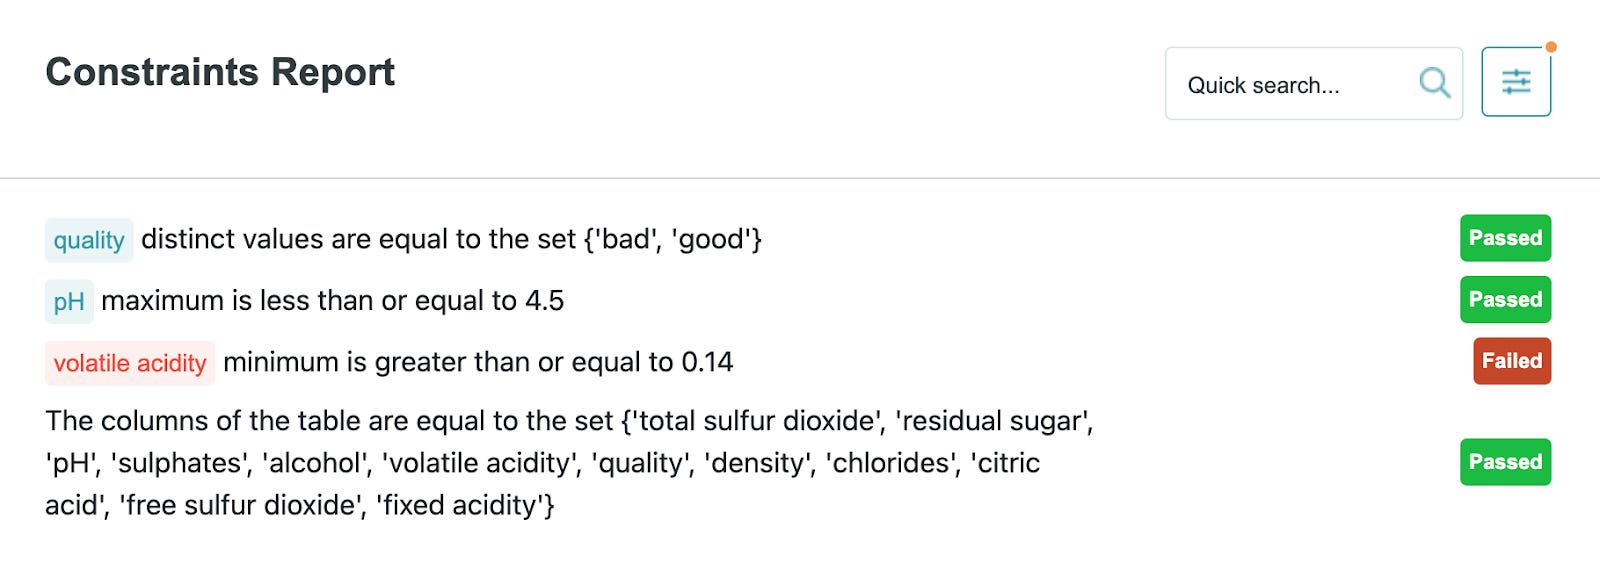
With profile constraints, you can save hours of extra work by preventing data bugs before they have an opportunity to propagate throughout the entire data pipeline. Simply define tests for your data and get alerted if data doesn’t look the way you expect it to. This enables data unit testing and data quality validation. Constraints might look like:
Better yet, setting up constraints is even easier with the To get started with constraints, check out this example notebook. Profile Visualizer
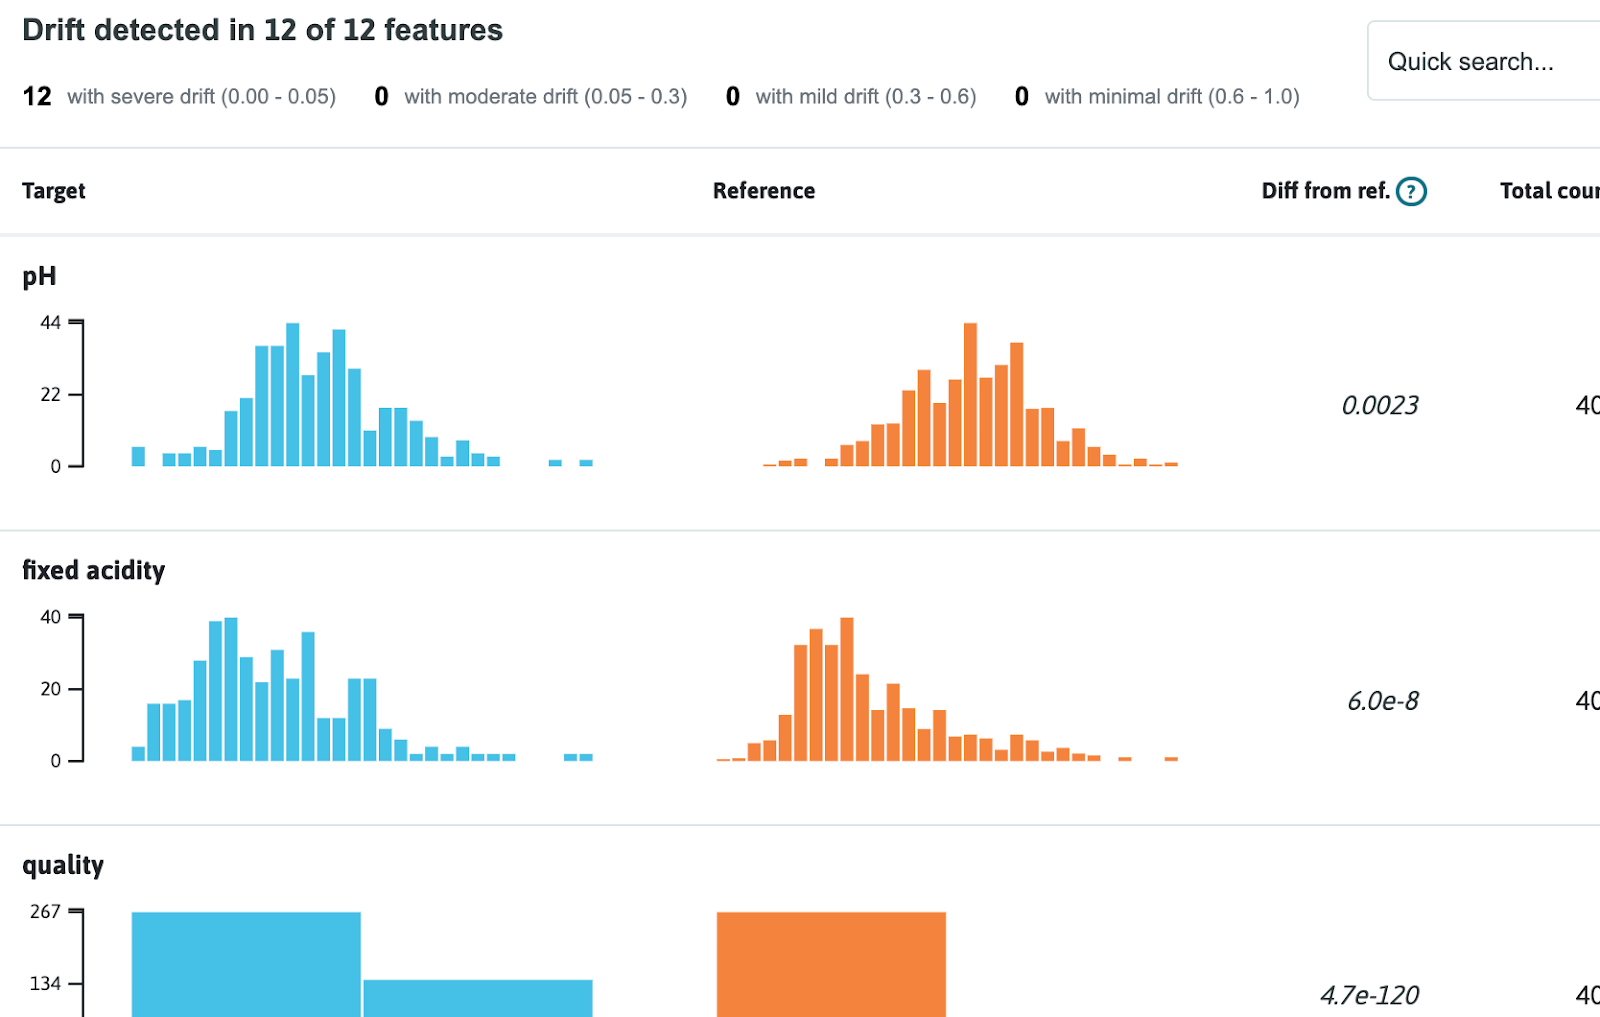
In addition to being able to automatically get notified about potential issues in data, it’s also useful to be able to inspect your data visually. With the profile visualizer, you can generate interactive reports about your profiles (either a single profile or comparing two profiles) directly in your Jupyter notebook environment. This enables exploratory data analysis, data drift detection, and data observability. The profile visualizer lets you create some useful visualizations of your data:
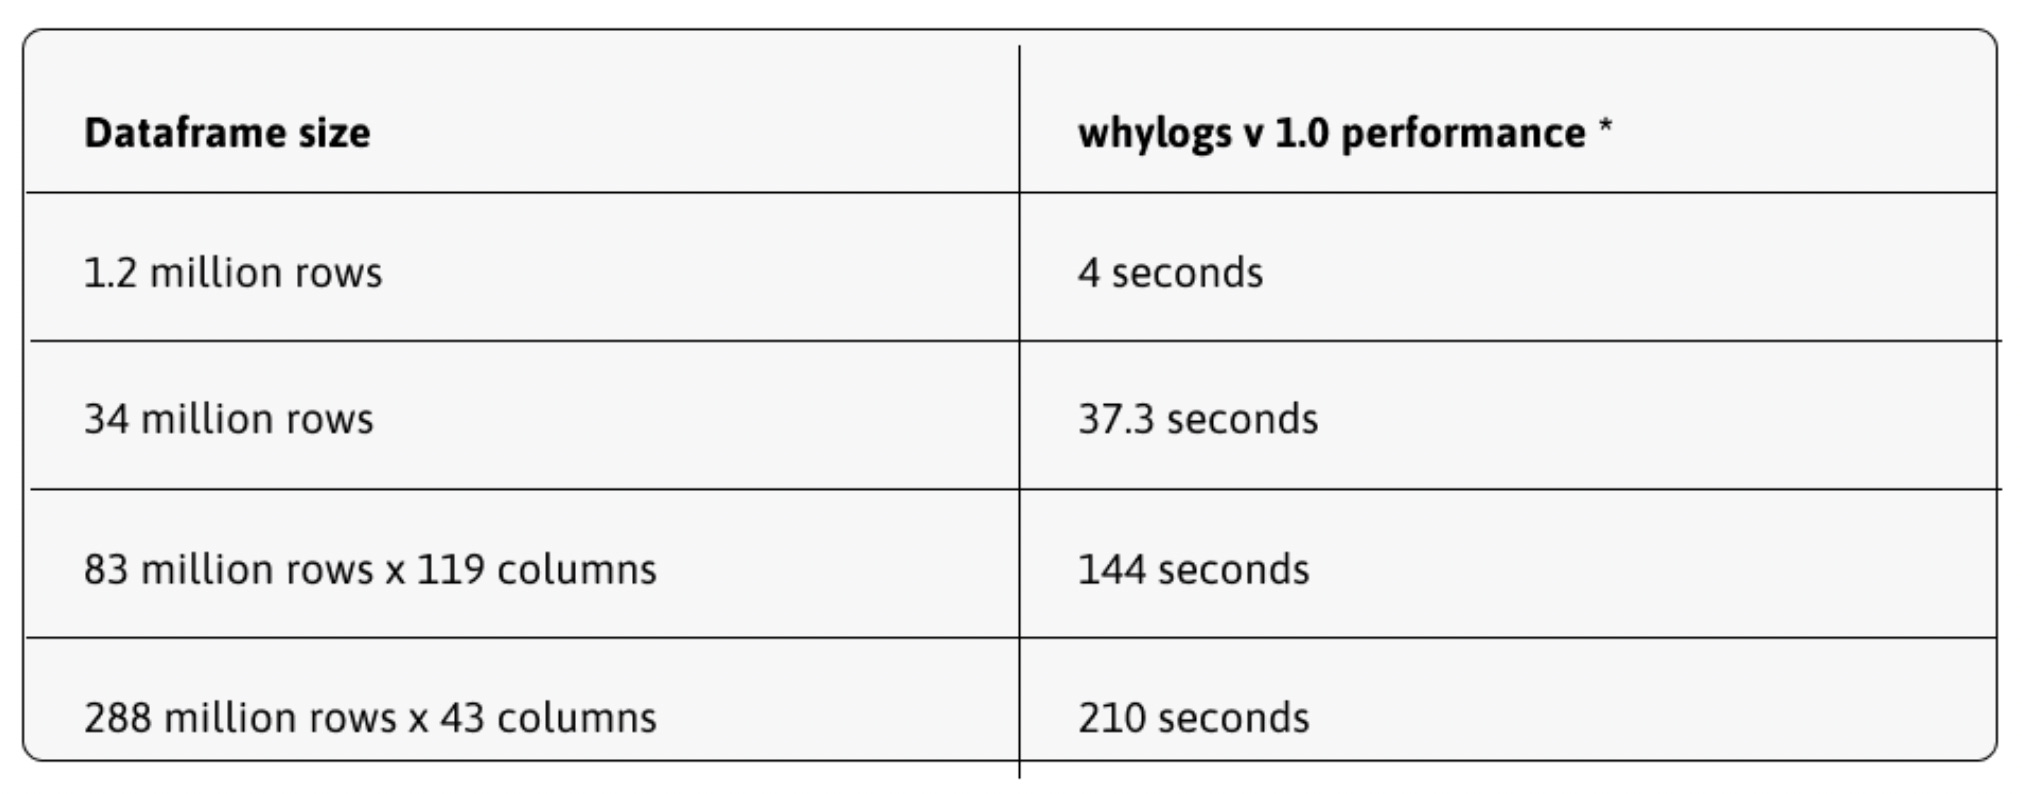
To learn more about the profile visualizer, check out this example notebook. Performance improvementsWith the latest performance improvements in v1, you can now profile 1M rows per second. Across all benchmarks, there was a more than 500x improvement in the ability of whylogs to profile large datasets compared to previous versions. Wow!
The secret to this performance improvement is vectorization; the library now utilizes lightning-fast C performance for data summarization. The time it takes to profile a dataset grows sub-linearly, so profiling larger datasets takes less time per row than profiling smaller ones, while smaller datasets are still easily profiled in under a second. With such performance, whylogs will serve teams who work with data of any size, from a few million rows per week to billions of transactions per minute. ConclusionThe whylogs project is the open-source standard for data logging, enabling applications spanning from data quality validation to ML model monitoring. With whylogs v1, users get more value with the library than ever before. You can get started with the library or check out the whylogs GitHub to learn more. *This post was written by the WhyLabs team. We thank WhyLabs for their ongoing support of TheSequence.You’re on the free list for TheSequence Scope and TheSequence Chat. For the full experience, become a paying subscriber to TheSequence Edge. Trusted by thousands of subscribers from the leading AI labs and universities.
© 2022 Jesus Rodriguez, Ksenia Semenova
|


Older messages
💠 Edge#195: A New Series About Graph Neural Networks
Tuesday, May 31, 2022
In this issue: we start a new series about graph neural networks (GNN); we observe how DeepMind showcases the potential of GNN; we discuss Deep Graph Library, a framework for implementing GNNs. Enjoy
🟥🟩🟦🟨 Microsoft’s New ML Announcements
Sunday, May 29, 2022
Weekly news digest curated by the industry insiders
🎙 Mike Del Balso/CEO of Tecton about Operational ML and ML Flywheels
Friday, May 27, 2022
It's so inspiring to learn from practitioners and thinkers. Getting to know the experience gained by researchers, engineers, and entrepreneurs doing real ML work is an excellent source of insight
👁 Edge#194: Masterful AI, the Training Platform for Automated Computer Vision
Thursday, May 26, 2022
On Thursdays, we do deep dives into one of the freshest research papers or technology frameworks that is worth your attention. Our goal is to keep you up to date with new developments in AI and
🧠 Why subscribe to TheSequence?
Wednesday, May 25, 2022
#1 AI Newsletter on Substack
You Might Also Like
Import AI 399: 1,000 samples to make a reasoning model; DeepSeek proliferation; Apple's self-driving car simulator
Friday, February 14, 2025
What came before the golem? ͏ ͏ ͏ ͏ ͏ ͏ ͏ ͏ ͏ ͏ ͏ ͏ ͏ ͏ ͏ ͏ ͏ ͏ ͏ ͏ ͏ ͏ ͏ ͏ ͏ ͏ ͏ ͏ ͏ ͏ ͏ ͏ ͏ ͏ ͏ ͏ ͏ ͏ ͏ ͏ ͏ ͏ ͏ ͏ ͏ ͏ ͏ ͏ ͏ ͏ ͏ ͏ ͏ ͏ ͏ ͏ ͏ ͏ ͏ ͏ ͏ ͏ ͏ ͏ ͏ ͏ ͏ ͏ ͏ ͏ ͏ ͏ ͏ ͏ ͏ ͏ ͏ ͏ ͏ ͏ ͏ ͏ ͏ ͏ ͏ ͏ ͏
Defining Your Paranoia Level: Navigating Change Without the Overkill
Friday, February 14, 2025
We've all been there: trying to learn something new, only to find our old habits holding us back. We discussed today how our gut feelings about solving problems can sometimes be our own worst enemy
5 ways AI can help with taxes 🪄
Friday, February 14, 2025
Remotely control an iPhone; 💸 50+ early Presidents' Day deals -- ZDNET ZDNET Tech Today - US February 10, 2025 5 ways AI can help you with your taxes (and what not to use it for) 5 ways AI can help
Recurring Automations + Secret Updates
Friday, February 14, 2025
Smarter automations, better templates, and hidden updates to explore 👀 ͏ ͏ ͏ ͏ ͏ ͏ ͏ ͏ ͏ ͏ ͏ ͏ ͏ ͏ ͏ ͏ ͏ ͏ ͏ ͏ ͏ ͏ ͏ ͏ ͏ ͏ ͏ ͏ ͏ ͏ ͏ ͏ ͏ ͏ ͏ ͏ ͏ ͏ ͏ ͏ ͏ ͏ ͏ ͏ ͏ ͏ ͏ ͏ ͏ ͏ ͏ ͏ ͏ ͏ ͏ ͏ ͏ ͏ ͏ ͏ ͏ ͏ ͏ ͏ ͏
The First Provable AI-Proof Game: Introducing Butterfly Wings 4
Friday, February 14, 2025
Top Tech Content sent at Noon! Boost Your Article on HackerNoon for $159.99! Read this email in your browser How are you, @newsletterest1? undefined The Market Today #01 Instagram (Meta) 714.52 -0.32%
GCP Newsletter #437
Friday, February 14, 2025
Welcome to issue #437 February 10th, 2025 News BigQuery Cloud Marketplace Official Blog Partners BigQuery datasets now available on Google Cloud Marketplace - Google Cloud Marketplace now offers
Charted | The 1%'s Share of U.S. Wealth Over Time (1989-2024) 💰
Friday, February 14, 2025
Discover how the share of US wealth held by the top 1% has evolved from 1989 to 2024 in this infographic. View Online | Subscribe | Download Our App Download our app to see thousands of new charts from
The Great Social Media Diaspora & Tapestry is here
Friday, February 14, 2025
Apple introduces new app called 'Apple Invites', The Iconfactory launches Tapestry, beyond the traditional portfolio, and more in this week's issue of Creativerly. Creativerly The Great
Daily Coding Problem: Problem #1689 [Medium]
Friday, February 14, 2025
Daily Coding Problem Good morning! Here's your coding interview problem for today. This problem was asked by Google. Given a linked list, sort it in O(n log n) time and constant space. For example,
📧 Stop Conflating CQRS and MediatR
Friday, February 14, 2025
Stop Conflating CQRS and MediatR Read on: my website / Read time: 4 minutes The .NET Weekly is brought to you by: Step right up to the Generative AI Use Cases Repository! See how MongoDB powers your