#21 SaaS Growth Strategy Model (Spreadsheet)
#21 SaaS Growth Strategy Model (Spreadsheet)Design high impact growth strategy for your SaaS business
You can read the web version of this newsletter here. Hunches are tricky things. Those who have toiled for years and sharpened their hunches on the battlefield acquire superhuman powers to see through the growth challenges. But for the rest of the mortals, their hunches often lead them straight off a cliff - their growth strategies fail miserably, when tested in the market. And then they lead to bewilderment. Today, in this post, I am going to share a data-based approach to designing a SaaS growth strategy that is insured against failure by the only truth that matters - the behavior of the existing users with the product. I am going to explain the model in this post and then, in the end, add a link to it for you. There are only two truths about SaaS growth strategies - first, a strategy is as good as the insights it's based upon, and second, a bad strategy takes almost the same effort to execute as it takes for a good strategy. Thus the fastest and most profitable way to design a good growth strategy is to spend most of the time and resources unearthing impactful insights. Data analysis is a powerful method to unearth insights, and today I will discuss everything you need to know to analyze data for SaaS growth. I will discuss the complete data-based growth model step by step and then link it at the end for you to download. Make sure to check the giveaway at the end of this post. Whether B2B or B2C, if you have a product-led self-serve model with a free plan (free trial or freemium), where users can sign up, experience the product, and then upgrade to paid plans, this model will immensely benefit you. Let's dive in. DatasetsFirst thing first, there are only four datasets that we need for this analysis:
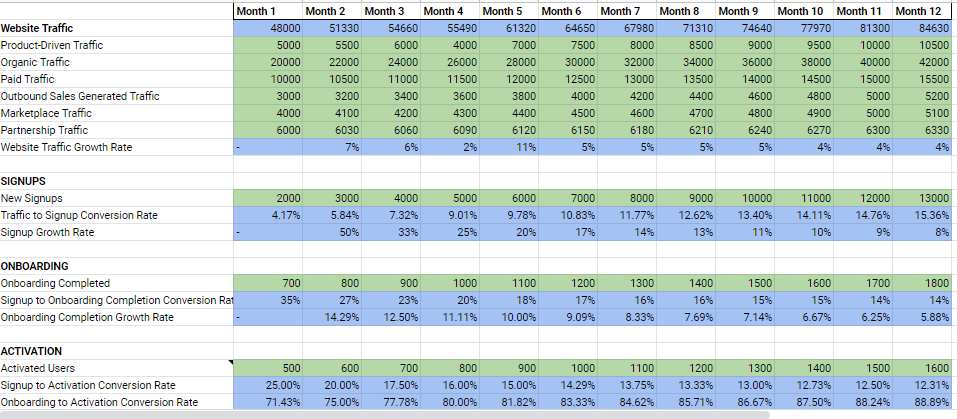
These four datasets cover the entire realm of behavioral, financial, and product usage insights we are interested in for designing a SaaS growth strategy. Free Plan Funnel AnalyticsA free plan funnel from signup to paid conversion is one of the easiest datasets to analyze and can point you toward your most compelling opportunities. Years ago, while digging into a client's free plan funnel data, I came across this SaaS KPI dashboard by Christoph Janz and used it extensively in my works. Over the years, I have customized it for my needs and transformed it into an end-to-end model that can help any SaaS team design growth strategy in a day or two without falling for vanity. The first step is to collect the past months' data for all major stages, from website visitors to paid conversion, and input it into a spreadsheet:
The first insight it will provide you is the conversion rate at each funnel stage and point out your next growth opportunity. For example, suppose the conversion rate from signup to onboarding is the least. In that case, even if you spend twice the current budget on bringing new traffic, most newly signed up users will not complete the onboarding. The increased traffic to your marketing website will, at best, lead to improvement in some vanity metrics and not real growth. Thus the model will tell you that your growth opportunities exist in improving the onboarding flow. But why should you worry about free plan users when they bring no revenue? In the product-led self-serve model, the quality of product engagement of free users directly affects their conversion to paid plans and the topline growth. Therefore you must optimize each stage of the free plan funnel before anything else. Paying Customers LifecyclePlan-wise monthly data of paying customers is second dataset to include in the growth model. You can learn about renewals and expansions by tracking and analyzing this dataset. To get a full view, you would want to track plan-wise data of:
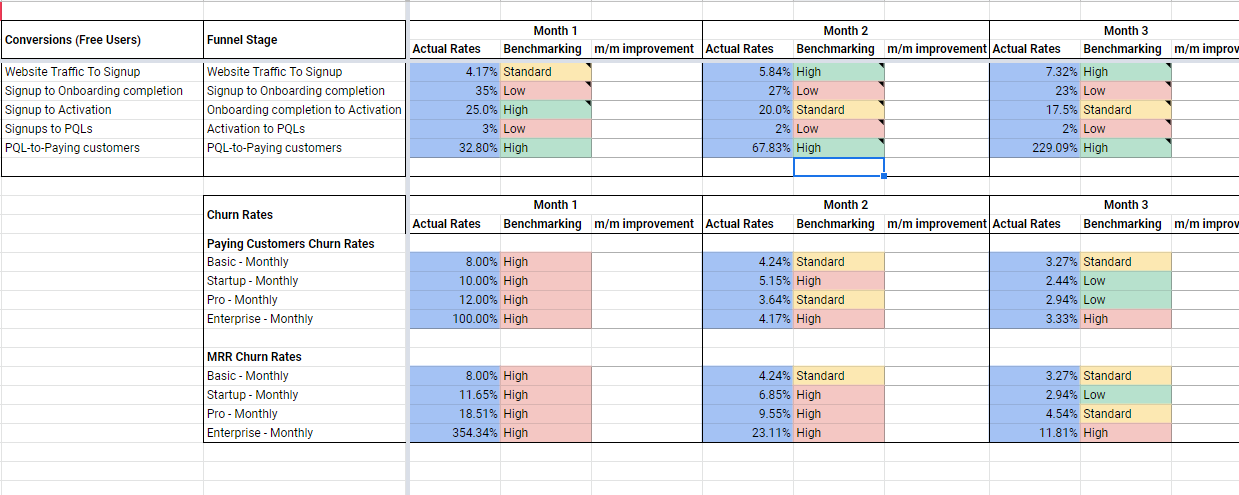
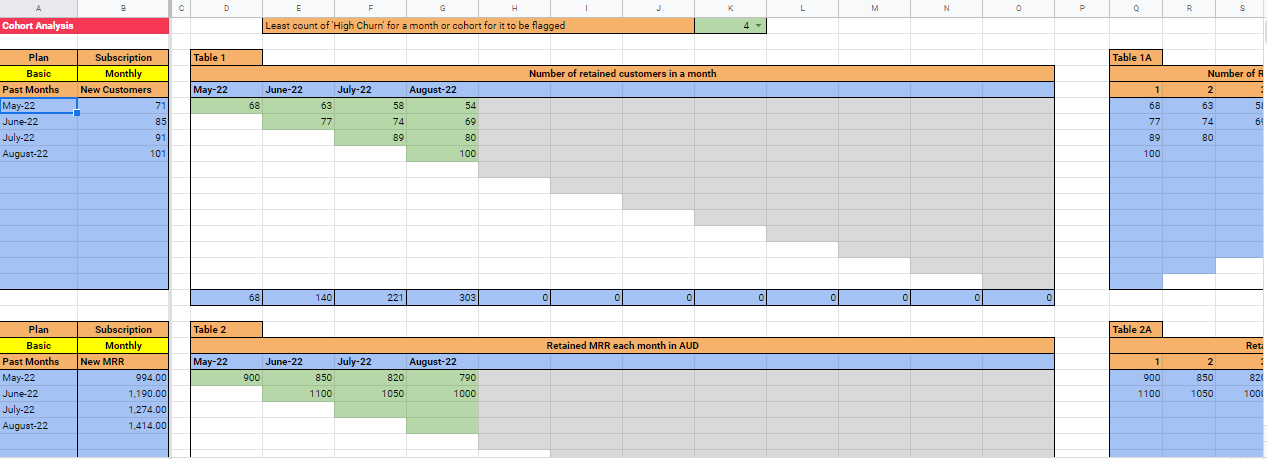
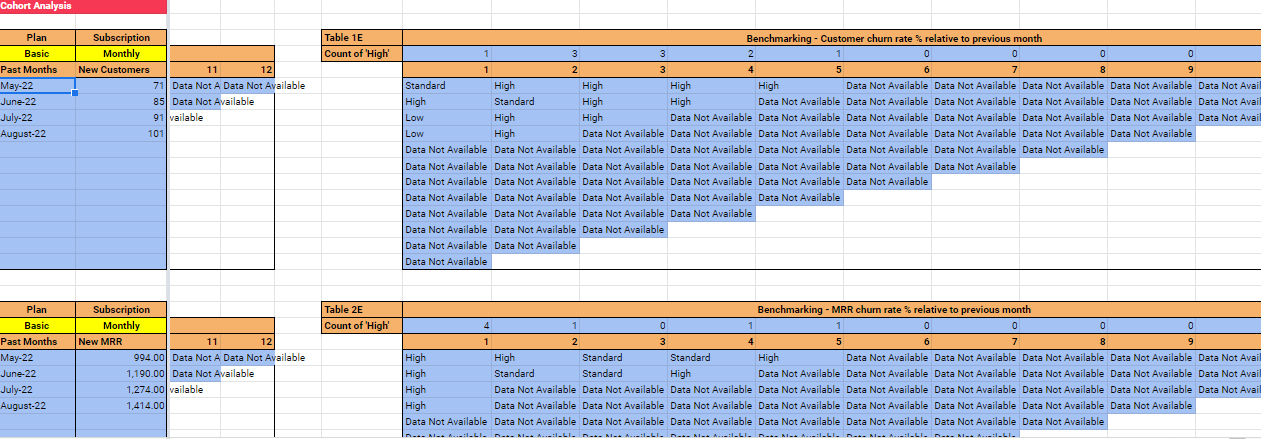
When you have multiple pricing tiers, number of customers are not linearly related with the MRR. Analyze the numbers of customers as well as monthly recurring revenue data to understand the effects of one on another. Conversion Rates BenchmarkingOne way to ascertain the performance of your growth activities is to compare your funnel conversion rates with industry averages. Every year organizations across the globe carry out SaaS research surveys and publish reports containing data you can use for benchmarking. Benchmark your funnel conversions against industry data and flag the critical stages. Align your growth strategies to improve these stages. Cohort AnalysisAn interesting phenomenon observed in internet businesses, specifically in SaaS businesses over the years, is the behavioral difference of user groups based on the time they become users. Thus it becomes helpful to club users in groups based on the month (or week) they have joined and then analyze the behavior of one group against the other. These groups are called cohorts. From a growth point of view, the data you need to look at is cohort-wise monthly retention numbers. The difference in retention numbers for two consecutive months will give you the number of churned customers. Divide this number by the total churned customers to get monthly on month cohort-wise churn rate. To make sense of these churn rates, benchmark them against industry rates and flag the critical ones. At the end of this analysis, you will have months and cohorts with the highest churn. Since you are working with the past data, you can discover the reasons retrospectively and optimize your strategy for the future. If you want to add intelligence to your cohort analysis, set a minimum threshold and flag a month (or a cohort) if the critical issues within it are more than that threshold. By doing so, you are safeguarding against issues arising either from one-off business problems or data-analysis calibrations. If you are new to cohort analysis, here is a good article by Christoph Janz. Anomalies DetectionSuppose there is an anomaly in the data. In that case, its inquiry can lead you to unearth hidden growth levers like market seasonality, product-market fit (or misfit), message-channel-audience fit, etc. There are many methods to detect an anomaly in a dataset, from simple statistical methods to sophisticated machine learning models. For SaaS funnel datasets, I have found three methods that are easy to implement in a spreadsheet and provide reasonably good output:
Depending on your business and dataset, one of these methods will be more suitable for you than the others. You can implement all three in your model, test each one by one, and select the one that provides better results. Targets & BudgetingA common fallacy I have observed in many SaaS growth strategy documents is the absence of targets vs. budget analysis. The disregard for budget calculation results in sub-optimal performance of the strategies. The cold hard truth people realize after many months into growth is that the growth of a business is proportional to the budget it can invest in growth. Good strategies result in higher growth per budget than bad ones, and that's about it. You can't fuel the engine of your growth just by a strategy document. There are no perpetual motion machines in the world. While analyzing the viability of your targets, there are two questions that you seek to answer:
Once you have answers to these questions, designing a growth strategy becomes easier as you get a financial framework to guide your actions. And how do you find how much budget you need? The most straightforward answer is to work backward in the funnel using acquisition cost per customer from the past data adjusted for the growth rate. Sensitivity AnalysisDifferent plans cater to different market segments and contribute differently to the growth of your business. One plan may bring the highest count of users; the second may get the highest revenue; the third may have high acquisition costs, while the fourth may exist at a sweet spot offering the best of all the worlds. A sensitivity analysis can help you rank plans based on their impact on your target metrics and thus help you better allocate resources to each plan. If you have four different pricing plans, each offering monthly and annual contract (subscriptions) types, then you have eight different plan-contract combinations. In this case, for the sensitivity analysis, you have eight variables contributing to the growth. You can find more than one ways to discover growth's sensitivity to these eight variables. A simple but effective method is to use four parameters:
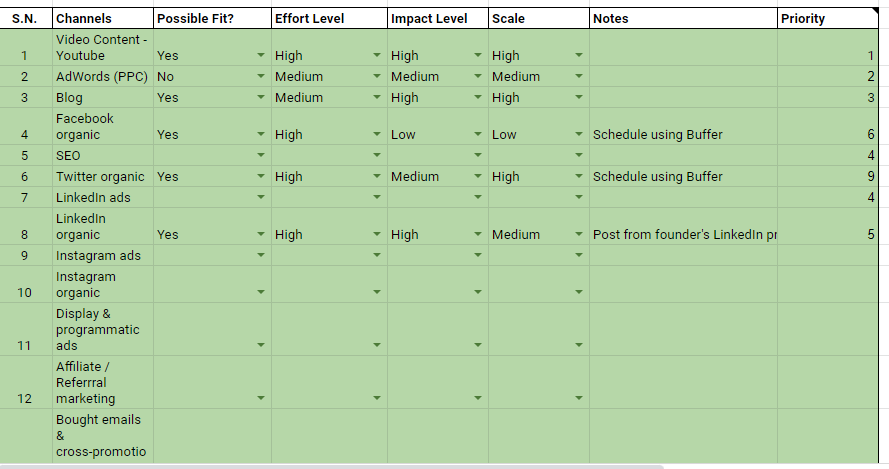
In a spreadsheet, rank each plan-contract combination on these parameters and select the one that ranks best overall. Downgrades AnalysisCustomers downgrading to smaller plans is a hole in your revenue stream. Your customer success and support teams can foresee such downgrades ahead of time if they have ready playbooks for these scenarios. Past data can highlight an out-of-the-normal downgrades concern in your business and enable you to develop playbooks accordingly. You also have the downgrades data when you track plan-wise renewals, cancellations, and expansions. Collate the data plan-wise and see which plan is exhibiting the highest downgrades. Channels & DistributionAcquisition channels let you reach out to your target audience and earn their attention. In the book 'Zero to One' Peter Thiel famously said that you need to build just one channel to be successful. However, not all channels are alike. The secret of building a successful channel resides in the discovery of message-channel-audience fit. There are many channels, and it's not rare to see businesses start with the wrong ones. There is no foolproof way to find the best channel for your business without some element of trial-and-error. However, there are reliable heuristics to shorten the learning curve and speed up the discovery of the best channel for your business. A tested heuristic that I follow is to list all possible channels, answer specific questions about them and then prioritize them. It saves me weeks of unnecessary information searching and months of wasted efforts on the wrong channels. I rank each channel on four parameters:
This process helps discard mismatched channels and outputs the top few channels for testing. When you publish any form of content - blog posts, podcasts, or videos, you will need to find out sites to promote and distribute them. You would want to do it primarily organic, and only in cases where there is high synergy between the platform's reach and your target audience, opt for their paid advertising. I have found it of long-term value to research online publications, newsletters, podcasts, communities, and relevant platforms that allow you to post updates and generate website traffic. Make a list of all such sources, research their reach and then prioritize them based on:
Sources that cater specifically to your audience will have high conversion rates. For example, top industry publications and niche newsletters can bring high-quality visitors resulting in high conversion rates. Mining Strategic InsightsWe have analyzed different datasets in multiple ways and are now ready to tie everything together in the form of a strategy. This model aims to provide you with data-based strategic insights that you can further use to build a complete strategy. Think of it as a framework to help you brainstorm growth strategies without falling for vanity. Here are the key elements that you should include in your strategy sheet:
Once you have completed the strategy sheet, you have a solid foundation for your growth activities. As you go about growth month after month, come back to this model with updated data to unearth new insights. You can now build the model yourself or download the pre-built model below and use it right away. I have built and improved the spreadsheet model over the years. It provides you with eight different types of data analysis, helps you select the top acquisition channels, unearths the high-impact growth levers, and in the end, gives you the best-fit growth strategies. Giveaway: SaaS Growth Strategy ModelClick Here to download the SaaS growth strategy model. The first 51 people will get a great discount:
Get it within the first 72-hours i.e. before 8:00 AM PDT, 01-October-2022 and you will also get:
Click Here To Get SaaS Growth Strategy Model❤️ Thanks for reading Issue #21. I'd truly appreciate it if you help me spread the word on Twitter by Clicking Here.
If you liked this post from Organic SaaS Growth, why not share it? |
Older messages
A Goldmine of Compelling Growth Insights
Tuesday, September 27, 2022
Discover hidden insights for SaaS growth
#20 Five Micro-Strategies for Organic SaaS Growth
Wednesday, May 4, 2022
Five SaaS Growth Questions Answered - April 2022
#19 The SaaS GTM Mega Series: The Mysterious Loop of Market Growth
Tuesday, February 1, 2022
Understand, select and conquer your market
#18 The Mega SaaS GTM Series: Field of possibilities
Sunday, November 14, 2021
Chapter 1: Scoping the field of possibilities
The Mega SaaS GTM series
Saturday, November 13, 2021
Heads up for tomorrow
You Might Also Like
🚀 Ready to scale? Apply now for the TinySeed SaaS Accelerator
Friday, February 14, 2025
What could $120K+ in funding do for your business?
📂 How to find a technical cofounder
Friday, February 14, 2025
If you're a marketer looking to become a founder, this newsletter is for you. Starting a startup alone is hard. Very hard. Even as someone who learned to code, I still believe that the
AI Impact Curves
Friday, February 14, 2025
Tomasz Tunguz Venture Capitalist If you were forwarded this newsletter, and you'd like to receive it in the future, subscribe here. AI Impact Curves What is the impact of AI across different
15 Silicon Valley Startups Raised $302 Million - Week of February 10, 2025
Friday, February 14, 2025
💕 AI's Power Couple 💰 How Stablecoins Could Drive the Dollar 🚚 USPS Halts China Inbound Packages for 12 Hours 💲 No One Knows How to Price AI Tools 💰 Blackrock & G42 on Financing AI
The Rewrite and Hybrid Favoritism 🤫
Friday, February 14, 2025
Dogs, Yay. Humans, Nay͏ ͏ ͏ ͏ ͏ ͏ ͏ ͏ ͏ ͏ ͏ ͏ ͏ ͏ ͏ ͏ ͏ ͏ ͏ ͏ ͏ ͏ ͏ ͏ ͏ ͏ ͏ ͏ ͏ ͏ ͏ ͏ ͏ ͏ ͏ ͏ ͏ ͏ ͏ ͏ ͏ ͏ ͏ ͏ ͏ ͏ ͏ ͏ ͏ ͏ ͏ ͏ ͏ ͏ ͏ ͏ ͏ ͏ ͏ ͏
🦄 AI product creation marketplace
Friday, February 14, 2025
Arcade is an AI-powered platform and marketplace that lets you design and create custom products, like jewelry.
Crazy week
Friday, February 14, 2025
Crazy week. ͏ ͏ ͏ ͏ ͏ ͏ ͏ ͏ ͏ ͏ ͏ ͏ ͏ ͏ ͏ ͏ ͏ ͏ ͏ ͏ ͏ ͏ ͏ ͏ ͏ ͏ ͏ ͏ ͏ ͏ ͏ ͏ ͏ ͏ ͏ ͏ ͏ ͏ ͏ ͏ ͏ ͏ ͏ ͏ ͏ ͏ ͏ ͏ ͏ ͏ ͏ ͏ ͏ ͏ ͏ ͏ ͏ ͏ ͏ ͏ ͏ ͏ ͏ ͏ ͏ ͏ ͏ ͏ ͏ ͏ ͏ ͏ ͏ ͏ ͏ ͏ ͏ ͏ ͏ ͏ ͏ ͏ ͏ ͏ ͏ ͏ ͏ ͏ ͏ ͏ ͏ ͏ ͏ ͏ ͏
join me: 6 trends shaping the AI landscape in 2025
Friday, February 14, 2025
this is tomorrow Hi there, Isabelle here, Senior Editor & Analyst at CB Insights. Tomorrow, I'll be breaking down the biggest shifts in AI – from the M&A surge to the deals fueling the
Six Startups to Watch
Friday, February 14, 2025
AI wrappers, DNA sequencing, fintech super-apps, and more. ͏ ͏ ͏ ͏ ͏ ͏ ͏ ͏ ͏ ͏ ͏ ͏ ͏ ͏ ͏ ͏ ͏ ͏ ͏ ͏ ͏ ͏ ͏ ͏ ͏ ͏ ͏ ͏ ͏ ͏ ͏ ͏ ͏ ͏ ͏ ͏ ͏ ͏ ͏ ͏ ͏ ͏ ͏ ͏ ͏ ͏ ͏ ͏ ͏ ͏ ͏ ͏ ͏ ͏ ͏ ͏ ͏ ͏ ͏ ͏ ͏ ͏ ͏ ͏ ͏ ͏ ͏ ͏ ͏ ͏ ͏
How Will AI-Native Games Work? Well, Now We Know.
Friday, February 14, 2025
A Deep Dive Into Simcluster ͏ ͏ ͏ ͏ ͏ ͏ ͏ ͏ ͏ ͏ ͏ ͏ ͏ ͏ ͏ ͏ ͏ ͏ ͏ ͏ ͏ ͏ ͏ ͏ ͏ ͏ ͏ ͏ ͏ ͏ ͏ ͏ ͏ ͏ ͏ ͏ ͏ ͏ ͏ ͏ ͏ ͏ ͏ ͏ ͏ ͏ ͏ ͏ ͏ ͏ ͏ ͏ ͏ ͏ ͏ ͏ ͏ ͏ ͏ ͏ ͏ ͏ ͏ ͏ ͏ ͏ ͏ ͏ ͏ ͏ ͏ ͏ ͏ ͏ ͏ ͏ ͏ ͏ ͏ ͏ ͏ ͏ ͏ ͏ ͏ ͏ ͏

