How to do linear regression and correlation analysis
How to do linear regression and correlation analysisSteps, methods, tools, and use cases for locating predictable user actions and improving retention👋 Hey, Lenny here! Welcome to this month’s ✨ free edition ✨ of Lenny’s Newsletter. Each week I tackle reader questions about building product, driving growth, and accelerating your career. If you’re not a subscriber, here’s what you missed this month: Subscribe to get access to these posts, and every post.
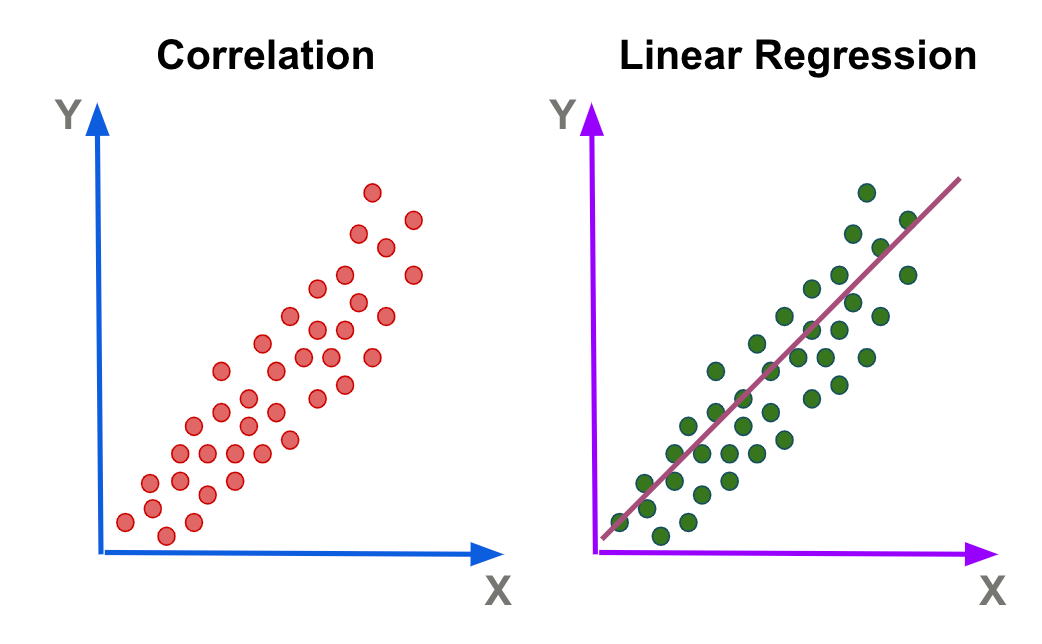
I’ll be honest. Though it’s come up in the newsletter a few times, I’ve also never truly understood what a regression analysis is. I know it helps you understand how two metrics are connected, but when exactly to run one, how to run one, and how regression differs from metrics being correlated, I’ve never deeply understood. I imagine many of you feel the same way. Considering how often these two methods come up, and (as you’ll see below) how powerful these tools can be, it’s important we all get smarter about this. To help us out, making her return appearance, I’ve pulled in Olga Berezovsky, author of the wonderful Data Analysis Journal newsletter, to explain what exactly correlation and regression analysis are, when to use one versus the other, how to run an analysis yourself (including recommended tools and templates), and a couple of common pitfalls to avoid. I’ve always wanted a simple, clear, and actionable explanation of correlation and regression analysis, and I’m excited to finally have one. You can find Olga on LinkedIn and Twitter, and subscribe to her newsletter for all kinds of great, actionable advice on data analysis and product analytics. Also, don’t miss Olga’s other guest post, on measuring cohort retention. Linear regression and correlation analysis are two of the most common (and crucial) methods for getting insights from data. Both are used as a foundation for predictions and forecasting, but they are hard to understand, often confused with each other, and difficult to do without prior training. In this post, I will cover the fundamentals of both linear regression and correlation analysis, demonstrate the primary use cases for each, and lay out steps and tools for how you can quickly conduct such analysis on your own. Correlation analysisCorrelation analysis illustrates the degree of a relationship between two variables, i.e. how closely they are correlated. The result is always between -1.0 and 1.0, where 1.0 denotes the highest positive correlation, -1.0 stands for the highest negative correlation (explained below), and 0 means no correlation: Correlation does not imply causation, but it’s the simplest and fastest way to locate which features or metrics correlate the most with high or low user engagement. In my work, I like to run a correlation analysis first thing when I am coming fresh to the data and looking for connections between metrics. For example, at MyFitnessPal, I used correlation analysis to understand if logging weight is correlated with starting a trial, or if stopping logging exercises is correlated with user churn. Examples of great use cases for doing correlation analysis:
There is a “positive” and “negative” correlationPositive correlation—increase in X is correlated with an increase in Y:
Negative correlation (or inverse correlation)—increase in X is correlated with a decrease in Y:
Depending on your question, you may find everything you need with just a correlation analysis. It’s simpler and faster to do than linear regression, it’s easier to understand, and this step alone might give you enough insight into your question. For example, if you simply want to measure the strength of the connection between, for example, a user seeing an upsell and activated trials, correlation would be sufficient. If, however, having the upsell view data, you want to predict new trials or gauge how much of the increase in showing upsells will be reflected in new trials, then you need linear regression. Note: If you jump straight to doing a linear regression and the values are not correlated, you’ll often find an inconclusive pattern. That’s why I recommend running a correlation analysis first—to confirm whether there is a correlation between X and Y, and if it’s a positive or negative correlation. Once you know if X and Y are related, then you can expand the analysis and predict Y using linear regression. Linear regressionLinear regression takes correlation analysis further and shows how much one variable affects another and, more importantly, whether you can use the pattern of one variable to predict and estimate the behavior of another. Importantly, just like correlation analysis, a linear regression doesn’t prove causation, but it does give you more confidence that there’s a strong connection between variables, plus how this connection is expected to change if you increase or decrease variables. Use cases for linear regression:
Per the last point, linear regression is also often used for predicting averages for user activity, growth, and revenue. For example, at Change.org I used regression to forecast the day and time when we hit 200 million users (and I was within 10 minutes right!). At MyFitnessPal we use linear regression to estimate how many meals users have to log to become “sticky” or how many days users have to use the app to upgrade their subscription plan. The difference between linear regression and correlation analysisCorrelation analysis confirms the relationship and connection between two variables. Linear regression analysis shows how much one variable affects another and how to predict, estimate, or explain its behavior. Another way to understand it:
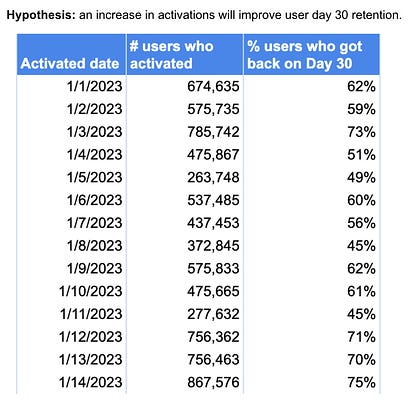
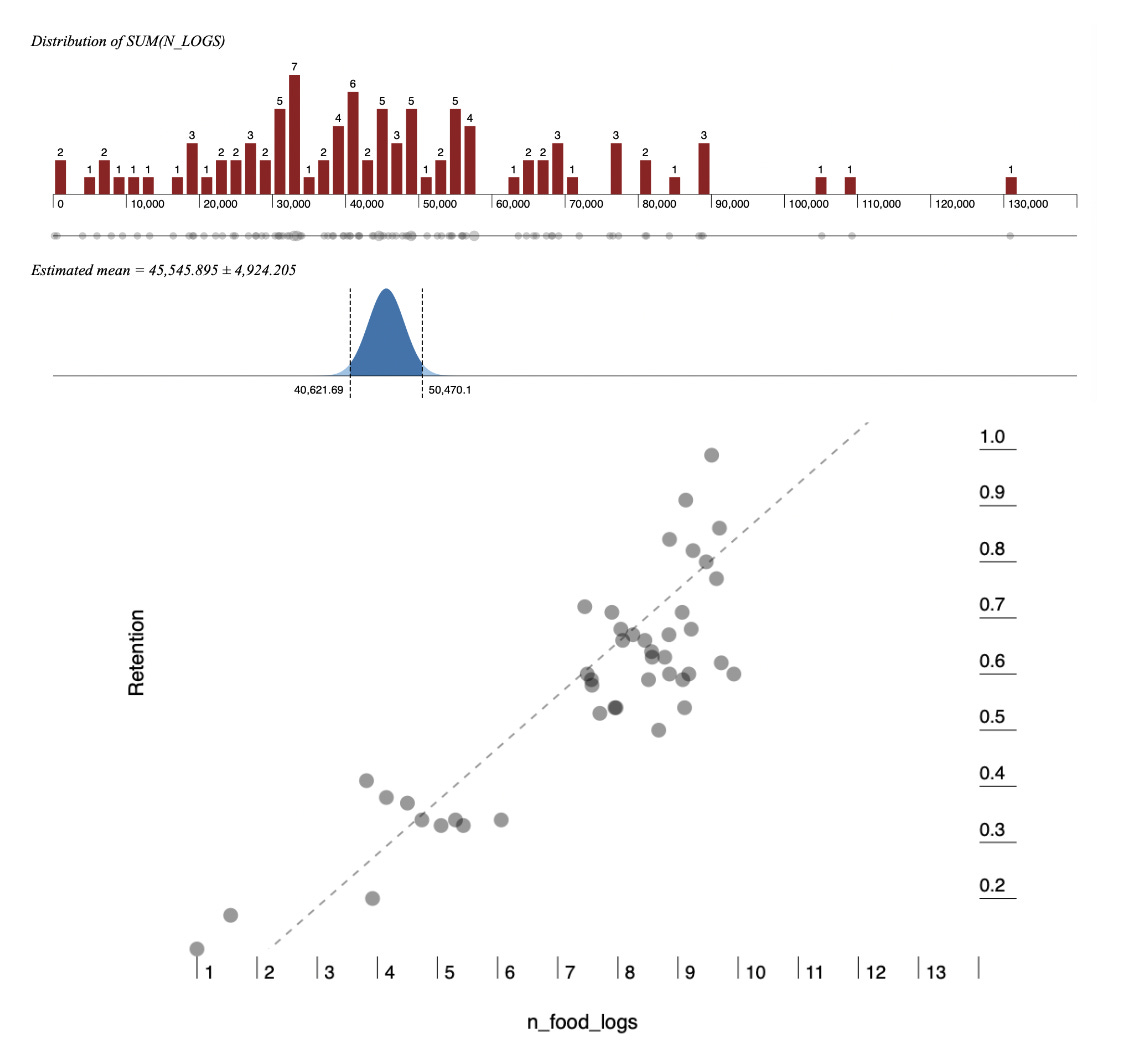
How to run a correlation and linear regression analysisTo demonstrate both of these analyses, I’ll share some of the work my team did at MyFitnessPal. We set out to prove that encouraging users to log more foods soon after signup would improve overall user retention. MyFitnessPal is the leading nutrition and food-tracking app, offering the tools to log meals quickly and easily. Using the app, users can track meals, learn about their habits, and reach their weight goals. For my analysis, I will be using “food logging events” to measure and analyze user engagement (see my previous guest post for advice on how to pick your “active” user metric). For your product, your active user metric could be app opens, session starts, screen views, requesting rides, booking a room, etc. To prove that food logging has an impact on user retention, I will be running both a correlation and linear regression (using dummy data), as an example:
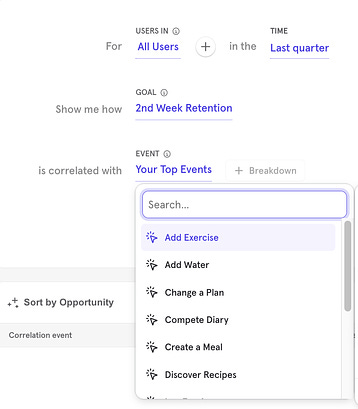
Running analysis using product analytics toolsUnlike my early years as an analyst, having to run such analysis in Excel, R, SPSS, or STATA software that required training and had a steep learning curve, today we can take advantage of product analytics tools that are intuitive and help you confirm the relationship between variables in seconds. Below I’ll show you a way to run such an analysis in Amplitude and Mixpanel, along with Excel, Google Sheets, and other tools. These digital analytics tools offer features that are similar to correlation and linear regression modeling. They use your historical data to help you locate signals, patterns, and connections by doing correlation analysis, and on top of that develop predictions of expected user behavior. In other words, using Mixpanel and Amplitude, you can do correlation and go slightly beyond that with predictions. For linear regression, I’ll show you how to supplement your analysis with Excel and Google Sheets. Amplitude—Compass featureIn Amplitude, you can click into the Analysis section and pick the Compass chart. Follow these steps to run a correlation analysis:
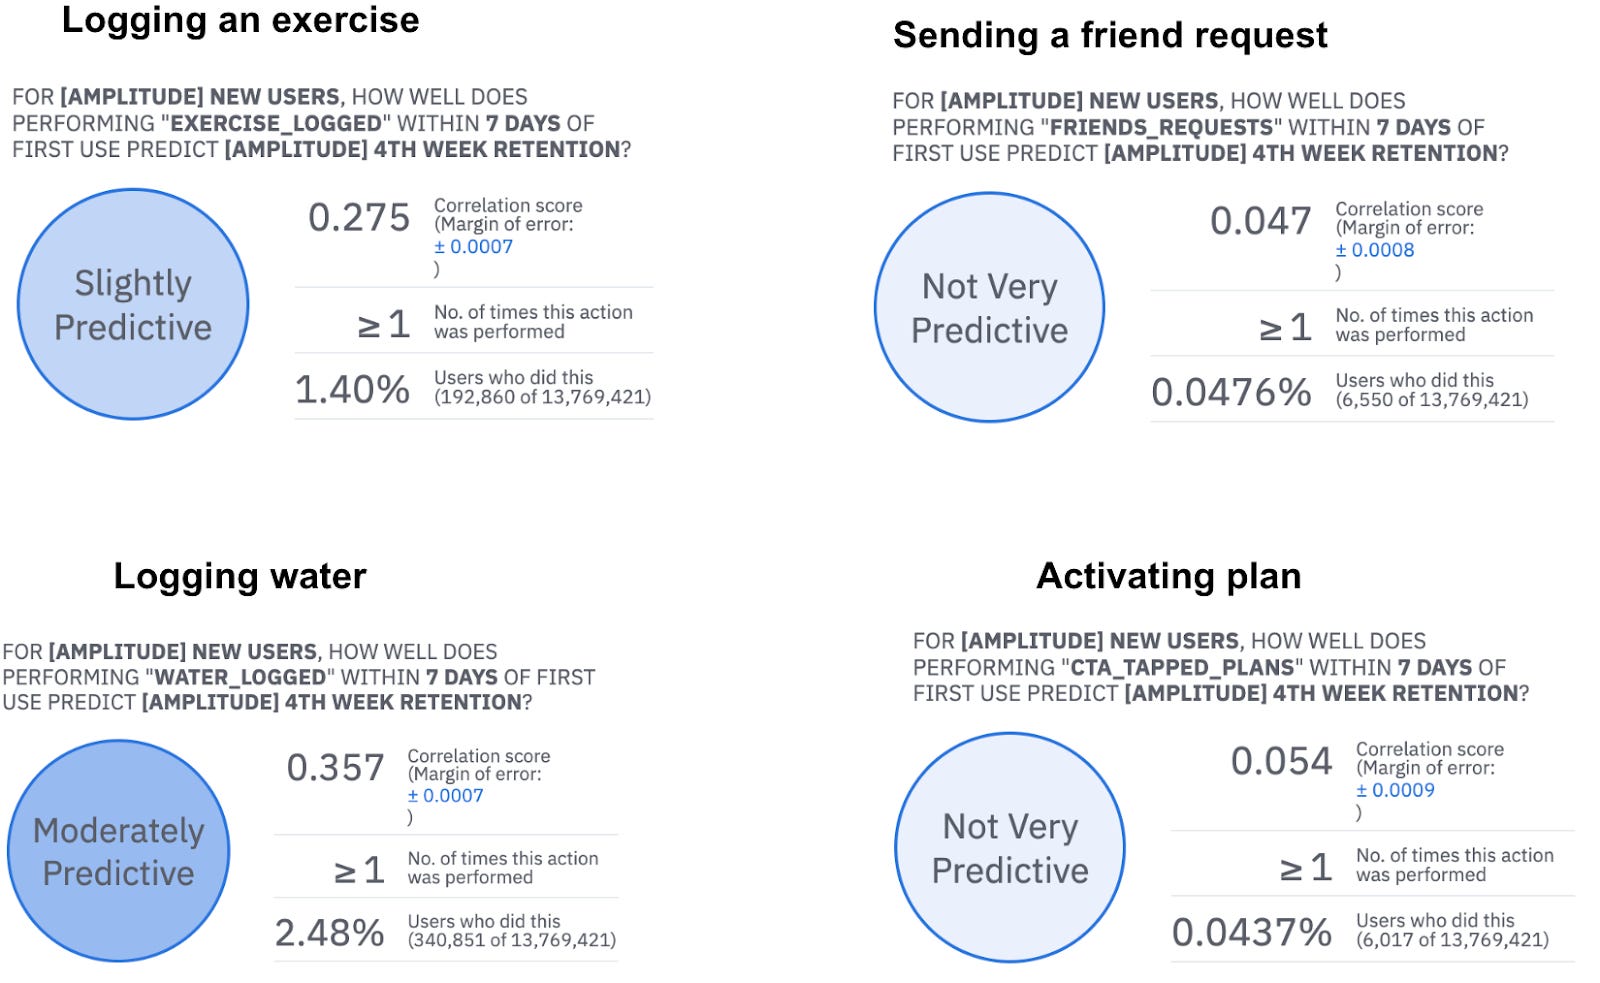
Compass returns the correlation score based on your input data (using a sample of data for reference): We received a 0.564 correlation score, which proves there is a relationship between food logging and user retention in this dataset. Amplitude says it’s “highly predictive,” meaning there is a high likelihood of food logging predicting high retention. That said, it doesn’t mean that new users registering tomorrow and logging more foods will have better retention. There is still work to do to prove that. This just indicates that based on our historical data:
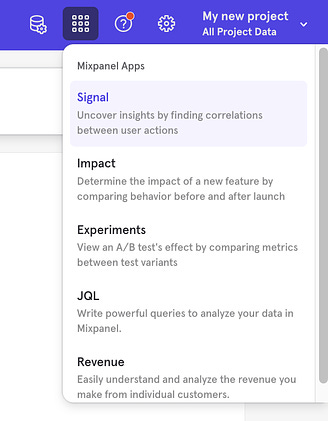
There is no proof yet that every new user who will log in twice as often will show improved retention. My next step here was to run the same analysis for other user activities and see if there is as strong a relationship for other MyFitnessPal features: water intake logging, plan activation, intermittent fasting, logging an exercise, etc. As you can see below, many other features don’t show as strong a correlation with retention: As a bonus, the Compass report in Amplitude also shows the impact of the frequency of activity on retention. For example, it helped us determine if logging food once in 7 days (versus, say, five times) is sufficient to detect improvement (it is). Mixpanel—Signal reportIn Mixpanel, you can use the Signal feature to confirm the relationship and connection between user activity and any of your metrics. To access this feature, click on Mixpanel Apps in the top navigation bar: Signal analyzes the correlation between an action and an outcome, to help you understand what user behavior drives conversion, retention, or growth. To create a Signal report in Mixpanel, follow these steps:
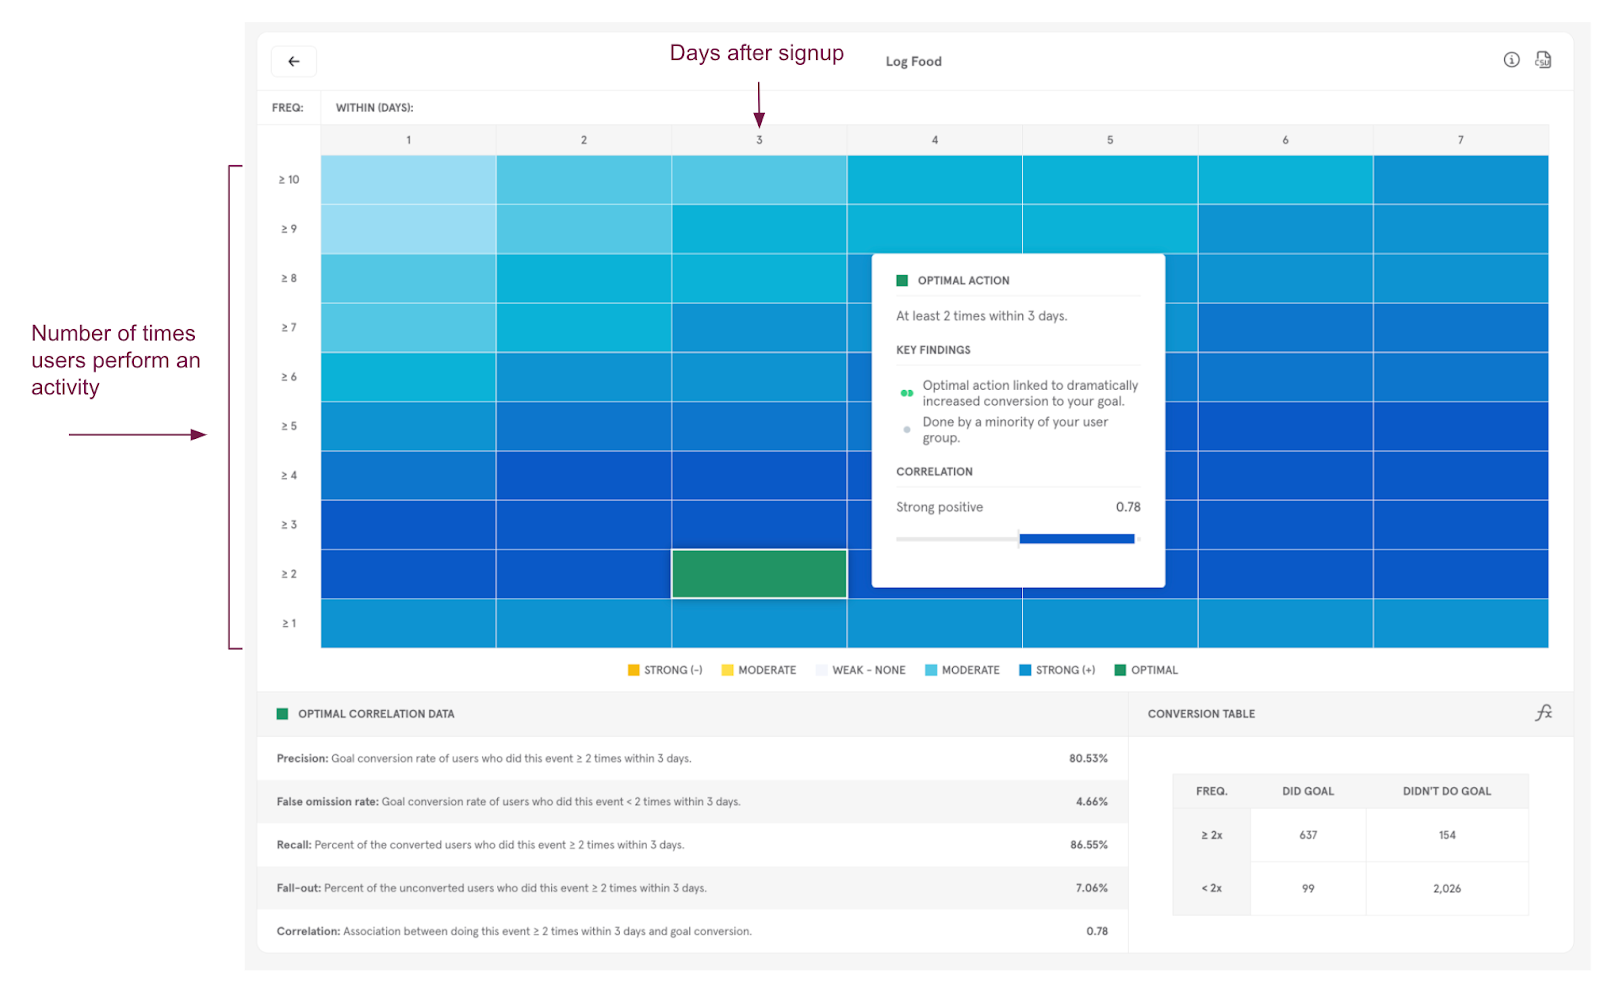
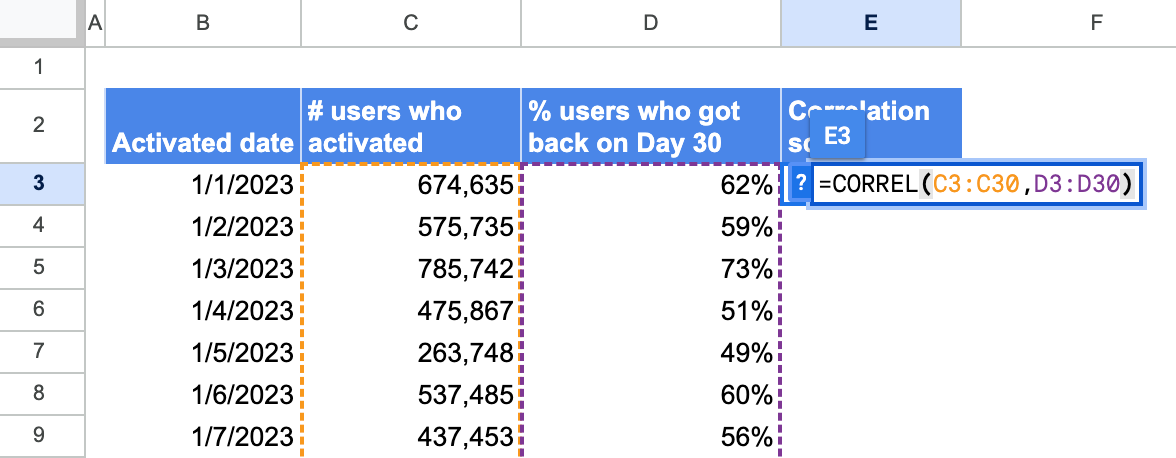
Signal returns the correlation score based on your inputs: In our example, we received a 0.78 correlation score, which proves logging food is strongly correlated with second-week retention in this dataset. If you click on “Details,” you can view the heatmap that helps you locate the ideal frequency of food logs to get the highest retention (not actual data; using an example for reference): Mixpanel suggests that this action needs to be completed at least 2 times within 3 days of registration to have an impact on user retention (see the green box above). We can run the same analysis for other user activities in our app to confirm if there is a strong relationship for other features, using the “Top features” breakdown: Mixpanel returns a list of top activities in the app along with their correlation score to user retention. It makes it very easy to locate strong product features. Both Amplitude and Mixpanel help us confirm the association between retention and food logs, and determine how strongly predictive these associations are and their pattern of relationship. They don’t, however, give us an estimate of how much we should increase food logs to improve active user retention. And this is what linear regression can help to uncover. To confirm any type of prediction, we have to leverage statistical tools to model the linear regression trend line. This can be done in Excel, Google Sheets, or in a number of free online tools. For Excel, you will need to install an additional package, the Analysis ToolPak. Once it’s downloaded, from the Data menu select Data Analysis, then select Regression. For running either a correlation or linear regression in Excel, you need to create two columns with your input data, like so (again, using made-up data): For Google Sheets, you can leverage functions and a scatterplot chart:
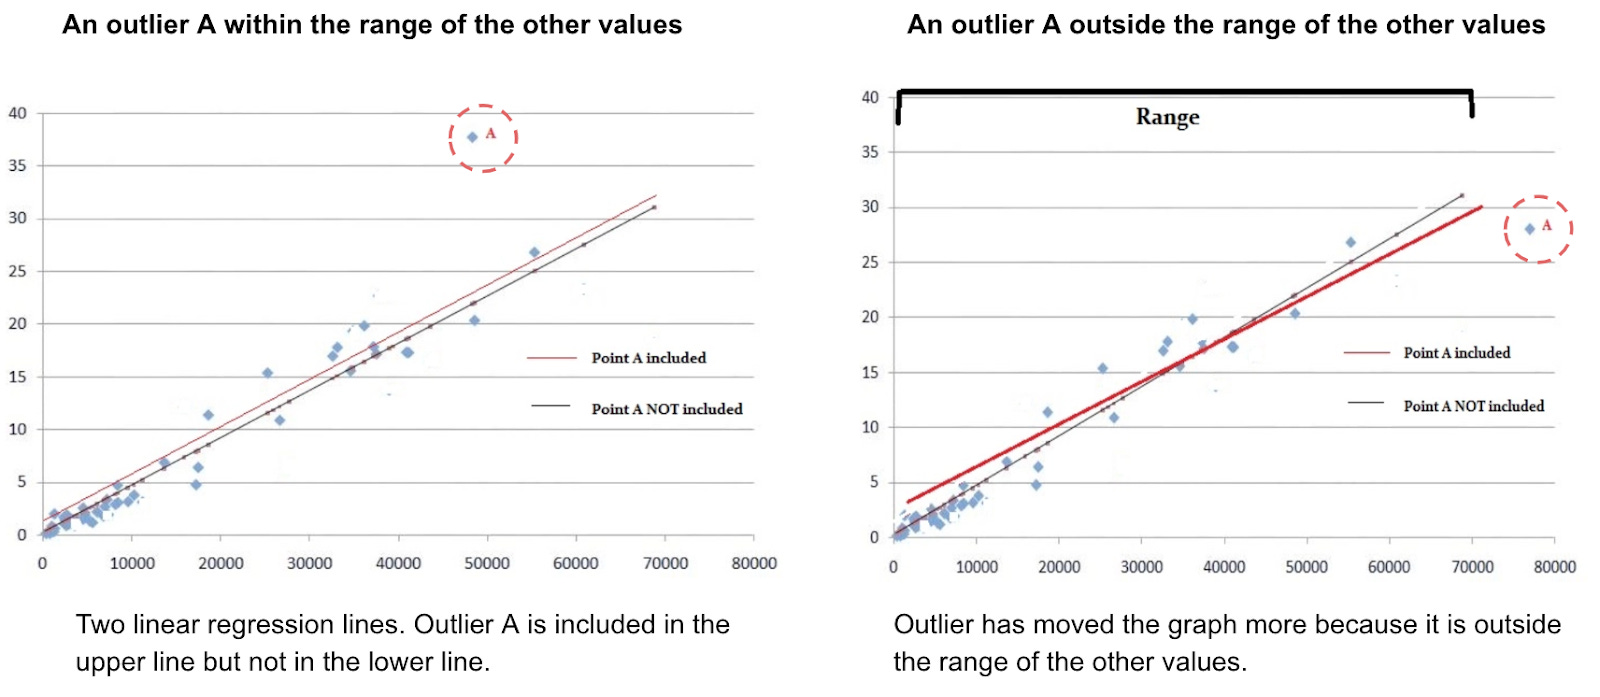
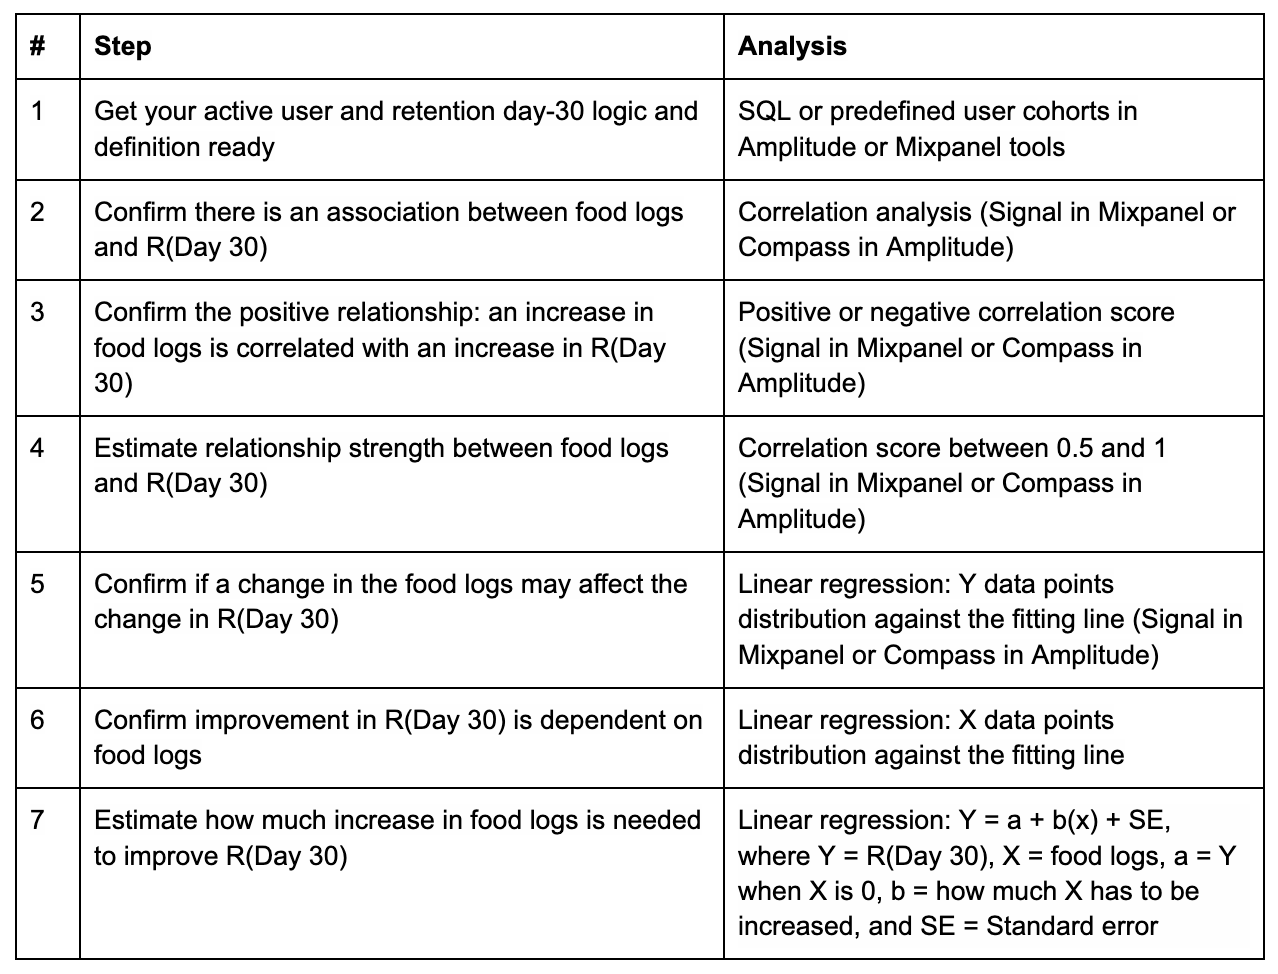
Here’s a quick template to help you get started: Correlation and Linear regression template. Alternatively, you can upload the same input data into online calculators such as DATAtab, Statistics Kingdom, or Social Science Statistics and get correlation and linear regression right in the tools. Note: Addressing outliers for linear regression is important. Depending on their value and position, outliers can affect the regression and change its trend line. In some cases, you should keep them, because they make your regression more precise (the image below on the left). In other cases, outliers deviate from the whole result and must be eliminated (the image on the right): Learn more about outliers in linear regression To understand which outliers should be removed, you have to see the whole distribution of your data points. As a rule of thumb, the closer outliers are to your average, the less likely they affect the regression. The further outliers fall from the average, the more leverage they have to skew the trend line. Additionally, you also need to consider data variance. If it’s overall high, you should keep extreme outliers. Read more: Leverage in Linear Regression: How it Affects Graphs. That’s why running linear regression on your own in Excel can be tricky. It’s safer to leverage online tools and statistical applications that can build the regression for you. If you need help with exploring outliers, different types of regressions, or distributions, I recommend using a product called Wizard. It helps you build a scatterplot in seconds, find outliers, find correlation scores, and more: To recap, here are the steps to run correlation and linear regression:Hypothesis: An increase in food logs will improve active user day-30 retention. To conclude
📚 Further study
Thanks, Olga! You can find Olga on LinkedIn and Twitter, and subscribe to her newsletter for all kinds of great, actionable advice on data analysis and product analytics. Have a fulfilling and productive week 🙏 📣 Join Lenny’s Talent Collective 📣If you’re hiring, join Lenny’s Talent Collective to start getting bi-monthly drops of world-class hand-curated product and growth people who are open to new opportunities. If you’re looking for a new gig, join the collective to get personalized opportunities from hand-selected companies. You can join publicly or anonymously, and leave anytime. ❤️🔥 Featured job opportunities
If you’re finding this newsletter valuable, share it with a friend, and consider subscribing if you haven’t already. Sincerely, Lenny 👋 |
Older messages
How to achieve hypergrowth in your business and career | Carilu Dietrich (Miro, Segment, Atlassian, 1Password)
Sunday, April 30, 2023
Listen now (67 min) | Brought to you by Rows—The spreadsheet where data comes to life | Braintrust—For when you needed talent, yesterday | Coda—Meet the evolution of docs — Carilu Dietrich is a former
What jury duty taught me about product management
Tuesday, April 25, 2023
Unexpected parallels and hidden lessons about leadership and product management from my experience on a jury
The ultimate guide to product-led sales | Elena Verna
Sunday, April 23, 2023
Listen now (76 min) | Brought to you by Linear—The new standard for modern software development | Braintrust—For when you needed talent, yesterday | Rows—The spreadsheet where data comes to life —
An inside look at how Miro builds product: Lessons on outmaneuvering competitors, team structure, product quality,…
Thursday, April 20, 2023
Listen now (85 min) | Brought to you by Miro—A collaborative visual platform where your best work comes to life | Braintrust—For when you needed talent, yesterday | Linear—The new standard for modern
How to build a cult-like brand | Laura Modi (Bobbie)
Wednesday, April 19, 2023
Listen now (61 min) | Brought to you by Vanta—Automate compliance. Simplify security | LMNT—Zero-sugar hydration | AssemblyAI—Production-ready AI models to transcribe and understand speech — Laura Modi
You Might Also Like
🚀 Ready to scale? Apply now for the TinySeed SaaS Accelerator
Friday, February 14, 2025
What could $120K+ in funding do for your business?
📂 How to find a technical cofounder
Friday, February 14, 2025
If you're a marketer looking to become a founder, this newsletter is for you. Starting a startup alone is hard. Very hard. Even as someone who learned to code, I still believe that the
AI Impact Curves
Friday, February 14, 2025
Tomasz Tunguz Venture Capitalist If you were forwarded this newsletter, and you'd like to receive it in the future, subscribe here. AI Impact Curves What is the impact of AI across different
15 Silicon Valley Startups Raised $302 Million - Week of February 10, 2025
Friday, February 14, 2025
💕 AI's Power Couple 💰 How Stablecoins Could Drive the Dollar 🚚 USPS Halts China Inbound Packages for 12 Hours 💲 No One Knows How to Price AI Tools 💰 Blackrock & G42 on Financing AI
The Rewrite and Hybrid Favoritism 🤫
Friday, February 14, 2025
Dogs, Yay. Humans, Nay͏ ͏ ͏ ͏ ͏ ͏ ͏ ͏ ͏ ͏ ͏ ͏ ͏ ͏ ͏ ͏ ͏ ͏ ͏ ͏ ͏ ͏ ͏ ͏ ͏ ͏ ͏ ͏ ͏ ͏ ͏ ͏ ͏ ͏ ͏ ͏ ͏ ͏ ͏ ͏ ͏ ͏ ͏ ͏ ͏ ͏ ͏ ͏ ͏ ͏ ͏ ͏ ͏ ͏ ͏ ͏ ͏ ͏ ͏ ͏
🦄 AI product creation marketplace
Friday, February 14, 2025
Arcade is an AI-powered platform and marketplace that lets you design and create custom products, like jewelry.
Crazy week
Friday, February 14, 2025
Crazy week. ͏ ͏ ͏ ͏ ͏ ͏ ͏ ͏ ͏ ͏ ͏ ͏ ͏ ͏ ͏ ͏ ͏ ͏ ͏ ͏ ͏ ͏ ͏ ͏ ͏ ͏ ͏ ͏ ͏ ͏ ͏ ͏ ͏ ͏ ͏ ͏ ͏ ͏ ͏ ͏ ͏ ͏ ͏ ͏ ͏ ͏ ͏ ͏ ͏ ͏ ͏ ͏ ͏ ͏ ͏ ͏ ͏ ͏ ͏ ͏ ͏ ͏ ͏ ͏ ͏ ͏ ͏ ͏ ͏ ͏ ͏ ͏ ͏ ͏ ͏ ͏ ͏ ͏ ͏ ͏ ͏ ͏ ͏ ͏ ͏ ͏ ͏ ͏ ͏ ͏ ͏ ͏ ͏ ͏ ͏
join me: 6 trends shaping the AI landscape in 2025
Friday, February 14, 2025
this is tomorrow Hi there, Isabelle here, Senior Editor & Analyst at CB Insights. Tomorrow, I'll be breaking down the biggest shifts in AI – from the M&A surge to the deals fueling the
Six Startups to Watch
Friday, February 14, 2025
AI wrappers, DNA sequencing, fintech super-apps, and more. ͏ ͏ ͏ ͏ ͏ ͏ ͏ ͏ ͏ ͏ ͏ ͏ ͏ ͏ ͏ ͏ ͏ ͏ ͏ ͏ ͏ ͏ ͏ ͏ ͏ ͏ ͏ ͏ ͏ ͏ ͏ ͏ ͏ ͏ ͏ ͏ ͏ ͏ ͏ ͏ ͏ ͏ ͏ ͏ ͏ ͏ ͏ ͏ ͏ ͏ ͏ ͏ ͏ ͏ ͏ ͏ ͏ ͏ ͏ ͏ ͏ ͏ ͏ ͏ ͏ ͏ ͏ ͏ ͏ ͏ ͏
How Will AI-Native Games Work? Well, Now We Know.
Friday, February 14, 2025
A Deep Dive Into Simcluster ͏ ͏ ͏ ͏ ͏ ͏ ͏ ͏ ͏ ͏ ͏ ͏ ͏ ͏ ͏ ͏ ͏ ͏ ͏ ͏ ͏ ͏ ͏ ͏ ͏ ͏ ͏ ͏ ͏ ͏ ͏ ͏ ͏ ͏ ͏ ͏ ͏ ͏ ͏ ͏ ͏ ͏ ͏ ͏ ͏ ͏ ͏ ͏ ͏ ͏ ͏ ͏ ͏ ͏ ͏ ͏ ͏ ͏ ͏ ͏ ͏ ͏ ͏ ͏ ͏ ͏ ͏ ͏ ͏ ͏ ͏ ͏ ͏ ͏ ͏ ͏ ͏ ͏ ͏ ͏ ͏ ͏ ͏ ͏ ͏ ͏ ͏


