How today’s top consumer brands measure marketing’s impact
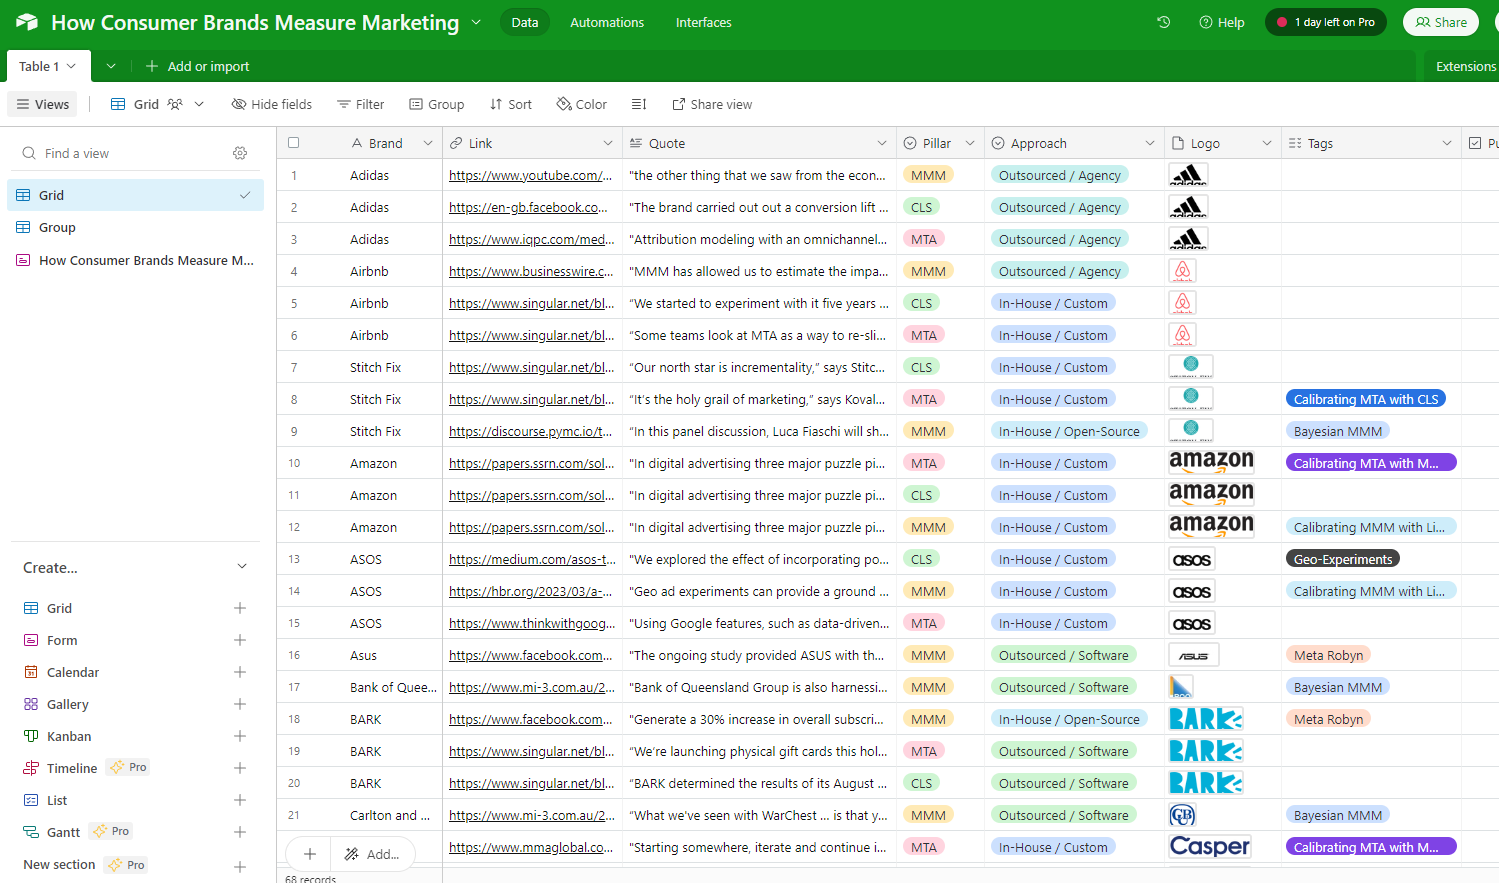
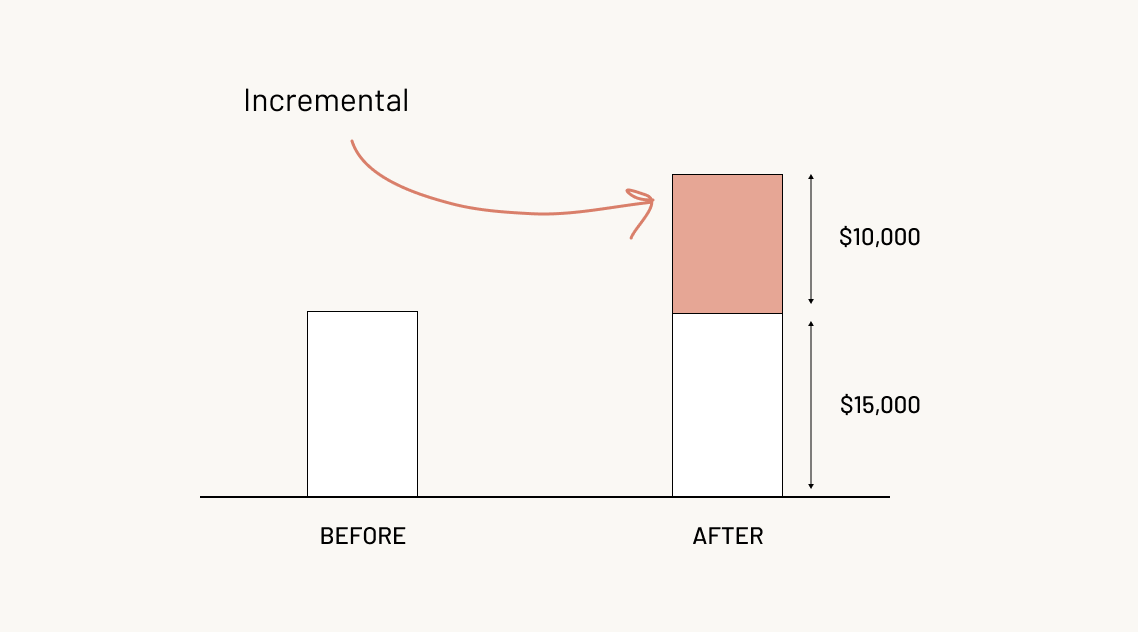
Below is a peek at today’s paid subscriber-only post. Subscribe today and get access to this issue—and every issue. How today’s top consumer brands measure marketing’s impactLessons from how 40+ brands measure their marketing impact, including McDonald’s, H&M, TikTok, Amazon, Airbnb, and Uber👋 Hey, I’m Lenny and welcome to a 🔒 subscriber-only edition 🔒 of my weekly newsletter. Each week I tackle reader questions about building product, driving growth, and accelerating your career. You won’t succeed at growth long-term without deeply understanding and operationalizing attribution and incrementality. Otherwise, you risk endlessly spending money on seemingly good ideas that have exactly zero impact. Michael Kaminsky and Mike Taylor are two of the most experienced people I’ve met on the dark arts of attribution and incrementality, and in today’s special guest post, they share the most in-depth and practical explanation I’ve ever seen on the topic. It’s based on primary research into how 42 top brands measure their marketing efforts, and I’m very excited to share it with you. Michael Kaminsky previously built the data team at the men’s shaving brand Harry’s and is the co-founder of marketing analytics firm Recast. Mike Taylor is the founder of the training platform Vexpower and previously built a 50-person growth marketing agency called Ladder. Many people encountering marketing measurement for the first time are surprised that it isn’t a solved problem. “I spend thousands of dollars on ads every day. I should be able to just pull a report to see what I got for it,” they might think. Unfortunately, even brands spending millions of dollars on advertising per month still struggle with measuring the impact of those dollars. The most important problem in marketing is this: If we spend an additional $1,000 on some marketing activity, how many additional sales would we drive? Marketers sometimes refer to this concept as “incrementality.” Incrementality is difficult to measure because we don’t get to observe the world where there’s no marketing activity, what a statistician might call the “counterfactual.” So even if we record some person clicking on an online advertisement and then making a purchase, we don’t know if this is correlation or causation: they might have made a purchase anyway, even without seeing the ad, because their friend told them about it, maybe, or because they already knew the brand. Navigating the labyrinth of marketing measurement is daunting at first glance, given the sheer variety of strategies available and the inherent complexity of the field. Although it’s true you can never achieve 100% clarity in marketing measurement, you’d be surprised at how close you can get by combining the right techniques. We’ve built a database of 42 top consumer brands, such as Uber, Amazon, and Airbnb, providing unique insights into their measurement methods. These case studies present inventive and thoughtful approaches to marketing measurement and will help you shortcut your way to measurement success. Check it out here. Building on this research, below, we demystify the complexity of each measurement technique and provide a guide on how they operate and, most importantly, how you can implement each of these methods yourself. We’ll show you exactly what the biggest consumer brands are using and what’s interesting about the way they’re using them.
How do top consumer brands measure marketing?There are three main ways that brands measure marketing effectiveness:
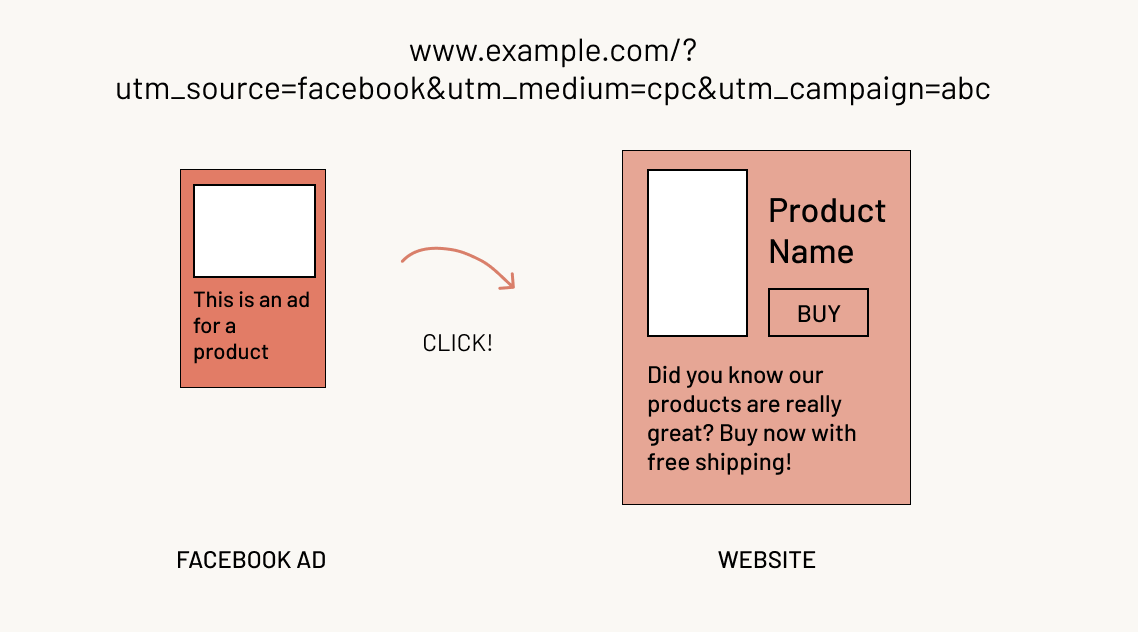
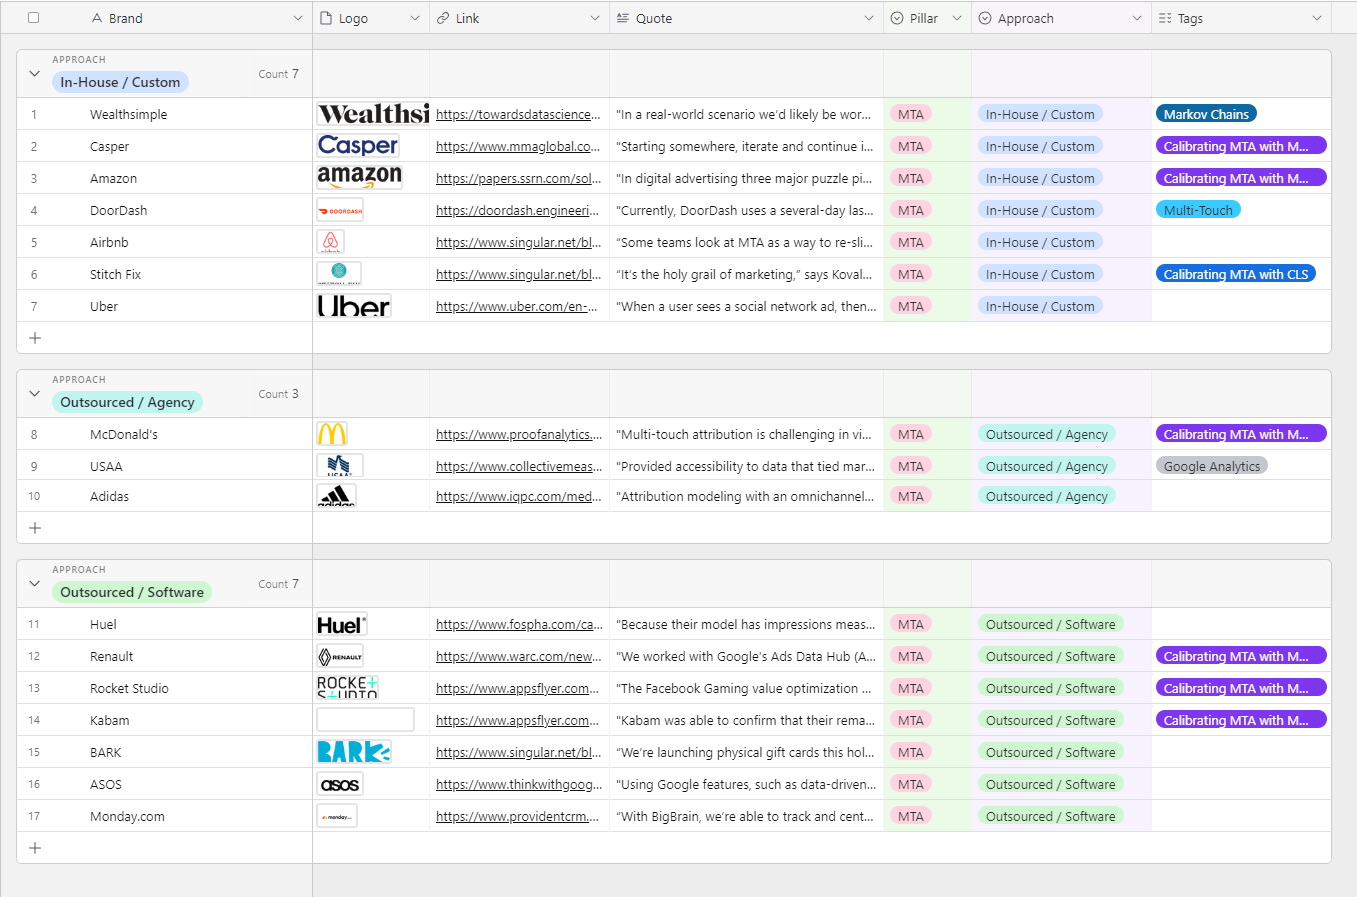
One growing trend we’ve seen in the database we created was the theme of “triangulation,” or using all three methods in conjunction with each other, to zero in on the truth of what’s working in marketing. Over 40% of the brands in the database are using at least two methods together, and around 20% use all three. Each of these methods has strengths and weaknesses, but by triangulating the truth through combining multiple methods, you can get a more accurate measurement. The goal of triangulation is to determine how many of your sales are “incremental,” meaning they wouldn’t have happened had you not invested in marketing. Using multiple measurement methods is like getting a second opinion after visiting the doctor: it can help you make better decisions. We’ll run through each of the methods, highlight how consumer brands are using them, and then walk you through how to implement them in your own business. Then we’ll cover how to combine them together through triangulation, so you can see how it works in practice for today’s top consumer brands. 1. MTA: Multi-touch attribution/digital trackingDigital tracking is measuring marketing performance through UTM codes or tracking pixels. When tracking is discussed, “last touch” or “last click” attribution is always mentioned as the default form of measurement on the internet. Last touch is easy to implement and understand, but it’s flawed because it gives zero credit to “touches” from other channels. Multi-touch attribution is a step more advanced, where you assign credit to different channels that a user interacted with (touched), based on predefined rules or a statistical model. The most consequential player in this space is Google and their measurement platform Google Analytics, which is installed on 60% of the top 100,000 websites. In addition to providing product analytics, GA is also used to measure the impact of marketing campaigns, which you can see in the source/medium report. We’ll talk through the basics of setting up analytics below, but there are thousands of high-quality walkthroughs on using GA for attribution across the internet and YouTube. How this works technically is that the analytics tool or advertising platform drops a cookie (a unique identifier) in your browser so it can track your behavior across the website, and even across multiple websites or devices. Marketers add UTM codes to the end of the URLs (?utm_source=facebook&utm_medium=cpc&utm_campaign=abc) that they use in their campaigns, which record where users came from, and an “event” is logged whenever they do something valuable, like buy the product or sign up as a user. The major distinction within this space is how you assign credit across channels. Users tend to not come from just one source—they may come back to the website multiple times via different channels before making a purchase or signing up. If you use the Google Analytics default “last touch” (assigning 100% of the credit to the last channel), you’ll favor lower-funnel channels like (surprise, surprise) Google Ads, as opposed to upper-funnel channels like TikTok or Instagram. Outside of Google Analytics, there are a variety of vendors in this space, including Rockerbox, Northbeam, and Triple Whale, and many companies have implemented variations of this technology internally (my team helped build our internal version of this when I was at Harry’s). How consumer brands use multi-touch attributionThis is by far the most ubiquitous method, and because most new startups are online, it’s usually the predominant method they use to measure marketing in the early growth stages. Paradoxically, because it’s so common, there are comparatively fewer case studies available compared with the other methods. You can safely assume that everyone that sells products online is using this method in some form, because everyone has Google Analytics installed. The cases we’ve included in the database are where they’re doing something interesting over and above the standard implementation of Google Analytics, like a custom model or unique approach. We found 17 instances of top brands talking about MTA in case studies, which is 40% of the brands featured, although it can be assumed that 100% of the brands use analytics and tracking pixels. Here are a few select quotes we found interesting, to highlight how top consumer brands are thinking about digital tracking/MTA:
It was surprising to me that a company as sophisticated as DoorDash would be using last-touch attribution, as detailed by Zhe Mai on their data science team. When I started in marketing over a decade ago, everyone was moving away from last-click, because it was universally agreed that it had obvious issues in biasing toward “lower funnel” channels like Google Ads. Lower-funnel channels are more likely to be the last channel that a user interacts with before purchasing, but they shouldn’t get 100% of the credit! However, I think the fact that DoorDash is still using it highlights the pervasive nature of the last-click model: it’s simple and easy to interpret, as well as being the easiest to measure, so it’s still very commonly used across the industry, including at very sophisticated companies.
This quote from Airbnb’s then–growth marketing lead Dmitry Stavitsky reminds us to not get sucked into the battle for budgets that attribution often comes down to. Different attribution models will make one channel look better than another, which can cause political infighting in siloed organizations. The goal should be to make marketing perform better, which ultimately leads to more success and financial reward for everyone working at the company.
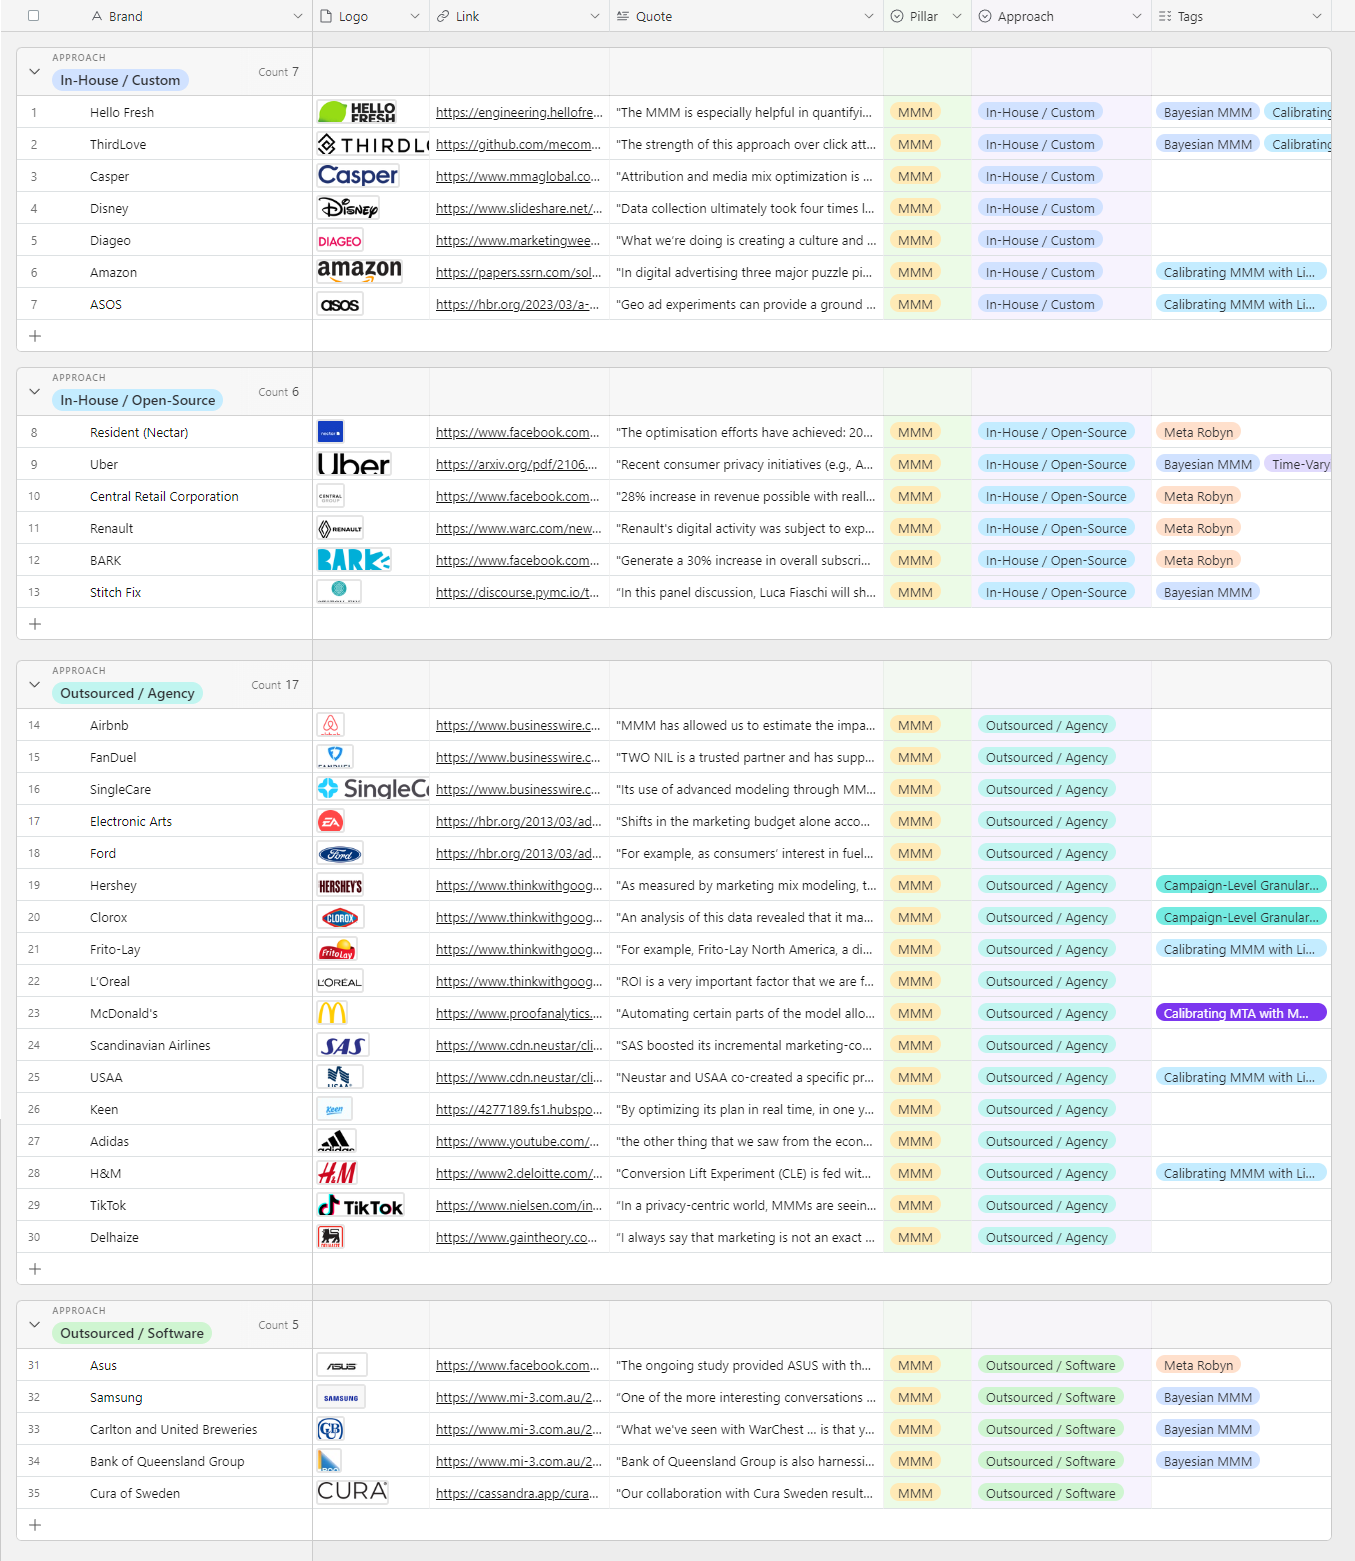
As you might expect, there were several cases where fast-growing startups and larger enterprises saw fit to build a custom system, like the one Uber describes above. Companies like Uber pride themselves on their engineering and statistical talent and have the capability to manage such software in-house, adapted to their specific needs. One thing that was surprising was how we couldn’t find any examples of open source software, even among companies that have open-sourced their software for other methods like marketing mix modeling, like Uber has with their “Orbit” model. Perhaps MTA software isn’t as generalizable, or it could be that it’s seen as a “secret sauce” internally. How to set up tracking and analyticsDigital tracking, despite its issues, is a good starting point for brands that are primarily online. Start with a tracking plan, which details what you want to track and when that occurs. This can take the form of an Excel spreadsheet on up to a dynamically updated event tracking system that’s integrated with your software deployment process or tag manager, depending on your required level of sophistication. Once you’ve agreed on your tracking plan, you should implement a tag manager, which lets you record data once and then push it to where you need it. Google provides a free product called Google Tag Manager, but there are also more sophisticated options like Segment that have a cost associated. The benefit of using a paid product is typically better collaboration and monitoring functionality, as well as ease of implementation. Now set up tracking pixels for each ad platform, and choose your analytics software. Google Analytics 4 is a good default for the web, although not everyone finds the interface to their liking. Mobile tracking is more complicated, because the Apple App Store is a barrier past which tracking parameters don’t cross. You have to use a link attribution service like AppsFlyer or Branch, which work with various methods to re-associate each install to the campaign they came from. Whatever stack you use, you’ll find more advanced use cases necessitate setting up a data warehouse that pulls in all your analytics data, as well as your advertising spend data via a provider like Supermetrics or Funnel.io. Once everything is in one place you can build your own MTA models, with your own rules, as well as analyze the data in various reports through a data visualization tool like Looker or Tableau. 2. MMM: Marketing mix modelingBefore we had the internet, how did marketers measure ads? You can’t click on a TV ad or tap on a newspaper to get to a website. In the 1960s a technique called marketing mix modeling (MMM), a subset of econometrics, was developed to measure the contribution of each channel to sales. More recently this technique has grown in popularity because it only needs aggregate data and therefore doesn’t have any privacy concerns. Meta’s open source Robyn library has made MMM more accessible, and a number of vendors (including Recast) have worked toward modernizing the technique. The method involves building an advanced statistical model, which correlates spikes and dips in sales with events and actions in marketing. So for example, if every time you increase paid advertising your organic sales rise, MMM can pick that up. This works independently of what your platform or analytics tool is telling you, so it’s used to fill the gaps in tracking and get a truer sense of what channels are really contributing to the bottom line. However, it can struggle with granularity at the campaign or creative level. Additionally, the results are very sensitive to the sophistication of the model, and it’s easy to get incorrect results if the model isn’t set up correctly. The big divide in methods is whether you use a traditional vendor like Nielsen or one of the more modern techniques. This is an important departure, because traditionally MMM is slow and expensive, meaning it’s usually run just once or twice a year, even by big brands. With more modern approaches, the models are more automated, and you can set up a data pipeline to update the model and optimize your marketing budget more regularly, like two to four times a month. How consumer brands use marketing mix modelingWe have the most case studies on this method because we built the database for a blog post on who’s talking about MMM in case studies. If we tried to collect case studies even five years ago, we would have been left with boring corporate drivel, but what’s normally a dry space has exploded since the advent of iOS 14, when Apple introduced the ability for users to say no to tracking. There has been a lot of innovation in the space, and, refreshingly, people seem eager to share what they’re doing, which has helped progress happen faster than it otherwise would. We found 35 instances of top brands talking about MMM in case studies, which is 82% of the brands featured. Here are a few select quotes we found interesting, to highlight how top consumer brands are thinking about MMM:
Uber pins down precisely the reason for all of the recent momentum in this space. With a big gap in MTA tracking, marketers can no longer rely entirely on that method and have been branching out to techniques like MMM. Uber has been a large proponent of this in releasing their open source library Orbit, which is technically sophisticated but isn’t a full out-of-the-box MMM solution. Uber was just one of the companies in the database using multiple methods: 40% of these brands had at least two case studies recorded using different methods, or mentioned more than one method in the same case study.
HelloFresh is one of the best-known companies among modern MMM proponents because it uses Bayesian techniques. Bayesian methods are helpful in the application of MMM because they allow for more complex specifications of the model while still capturing the underlying uncertainty. Many marketers tend to turn to MMM when they have a more complex marketing mix, like an advertiser that has multiple offline channels, for example. In fact, many of the clients we’ve worked with came to use it right around the time they decided to branch out into offline channels like TV or billboards, because of course you can’t measure these methods with digital tracking—you can’t click on a TV ad or billboard.
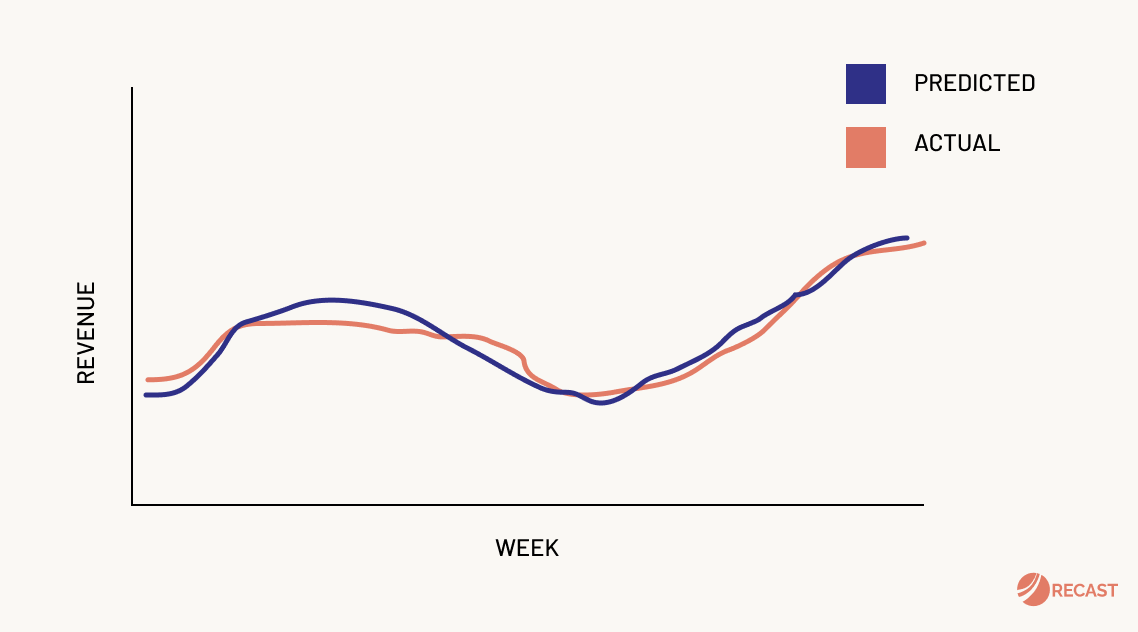
The case study from Resident, owner of the Nectar mattress brand, highlights both the benefit of MMM and the positive contribution of all of this investment in modern techniques. Done well, MMM should help you bring down your cost of acquisition or improve your return on investment, through helping you reallocate your budget. It’s easy for analysts to lose sight of that and fail to communicate the ultimate goal to the rest of the business, who get lost in the statistics. Meta’s open source library, Robyn, has democratized MMM for companies that didn’t have a data science team to custom build their models, and it does a fairly good job out of the box. It’s usually the first port of call for smaller clients, and often the people we work with have at least tested it on the path toward more sophisticated techniques. If you’re paying for a vendor to build your MMM, or working on your own custom solution, we recommend testing it head-to-head against Robyn to establish a good baseline for accuracy and performance. How to build a marketing mix modelWhen it comes to building your first MMM, you should buckle up for a three- to six-month project if you have a complicated set of marketing activities to model. Data collection and formatting might take you 40% to 60% of this time, particularly if you don’t have your house in order already. Tech startups that already have all their data in a data warehouse will accelerate through this phase, whereas legacy businesses that operate in silos might take a significant amount of time. Beginning this project might also spawn other projects to clean up your data or collect more of it, depending on what you find when you go looking for the data you need. We’ve found you can bring that timeline down to a couple of weeks when working with a vendor who has automated all the data collection, reporting, and forecasting. On the lower end this can be as simple as using Supermetrics or Funnel.io to dump your data into a Google spreadsheet, but on the higher end it could mean working with a vendor that has built a data warehouse and all the necessary connectors to the main marketing channels and analytics platforms, like we have done at Recast. If you plan to build a model in-house, either Meta’s Robyn or Google’s LightweightMMM would be a good solid base, but they obviously have their limitations and will need some customization for your use case. Uber’s Orbit uses time-varying coefficients, which means the performance of marketing can change over time in their models, which we think is essential and, as such, built our models around this principle. Remarkably, most MMMs assume marketing never improves or changes in performance, even around important seasonal trends or economic events. If you plan to go for a completely custom build, plan in anything from an additional three months to two years, which is how long it took us to exit our R&D phase at Recast. MMM is a hard statistical problem to solve, and is unusually unsuitable for solving through modern machine learning techniques. MMM has the joint goal of being accurate but also explainable: a model is useless if it can’t tell you which channel contributed to sales historically, or help you forecast out what to spend in each channel. 3. CLS: Conversion lift studies...Subscribe to Lenny's Newsletter to read the rest.Become a paying subscriber of Lenny's Newsletter to get access to this post and other subscriber-only content. A subscription gets you:
|
Older messages
M&A, competition, pricing, and investing | Julia Schottenstein (dbt Labs)
Sunday, July 16, 2023
Listen now (61 min) | Brought to you by Vanta—Automate compliance. Simplify security | Superhuman—The fastest email experience ever made | AssemblyAI—Production-ready AI models to transcribe and
LinkedIn’s product evolution and the art of building complex systems | Hari Srinivasan (LinkedIn)
Sunday, July 16, 2023
Listen now (65 min) | Brought to you by Miro—A collaborative visual platform where your best work comes to life | Brave Search API—An independent, global search index you can use to power your search
How Snowflake builds product
Tuesday, July 11, 2023
An interview with Jeff Hollan, Director of Product for Snowflake's Developer Platform and Ecosystem
How to ask the right questions, project confidence, and win over skeptics | Paige Costello (Asana, Intercom, Intui…
Sunday, July 9, 2023
Listen now (63 min) | Brought to you by Brave—An independent, global search index you can use to power your search or AI app | Attio—The powerful, flexible CRM for fast-growing startups | Round—The
How to pass any first-round interview (even in a terrible talent market)
Tuesday, July 4, 2023
Learn how to get that strong yes without burning yourself out with interview prep
You Might Also Like
🚀 Ready to scale? Apply now for the TinySeed SaaS Accelerator
Friday, February 14, 2025
What could $120K+ in funding do for your business?
📂 How to find a technical cofounder
Friday, February 14, 2025
If you're a marketer looking to become a founder, this newsletter is for you. Starting a startup alone is hard. Very hard. Even as someone who learned to code, I still believe that the
AI Impact Curves
Friday, February 14, 2025
Tomasz Tunguz Venture Capitalist If you were forwarded this newsletter, and you'd like to receive it in the future, subscribe here. AI Impact Curves What is the impact of AI across different
15 Silicon Valley Startups Raised $302 Million - Week of February 10, 2025
Friday, February 14, 2025
💕 AI's Power Couple 💰 How Stablecoins Could Drive the Dollar 🚚 USPS Halts China Inbound Packages for 12 Hours 💲 No One Knows How to Price AI Tools 💰 Blackrock & G42 on Financing AI
The Rewrite and Hybrid Favoritism 🤫
Friday, February 14, 2025
Dogs, Yay. Humans, Nay͏ ͏ ͏ ͏ ͏ ͏ ͏ ͏ ͏ ͏ ͏ ͏ ͏ ͏ ͏ ͏ ͏ ͏ ͏ ͏ ͏ ͏ ͏ ͏ ͏ ͏ ͏ ͏ ͏ ͏ ͏ ͏ ͏ ͏ ͏ ͏ ͏ ͏ ͏ ͏ ͏ ͏ ͏ ͏ ͏ ͏ ͏ ͏ ͏ ͏ ͏ ͏ ͏ ͏ ͏ ͏ ͏ ͏ ͏ ͏
🦄 AI product creation marketplace
Friday, February 14, 2025
Arcade is an AI-powered platform and marketplace that lets you design and create custom products, like jewelry.
Crazy week
Friday, February 14, 2025
Crazy week. ͏ ͏ ͏ ͏ ͏ ͏ ͏ ͏ ͏ ͏ ͏ ͏ ͏ ͏ ͏ ͏ ͏ ͏ ͏ ͏ ͏ ͏ ͏ ͏ ͏ ͏ ͏ ͏ ͏ ͏ ͏ ͏ ͏ ͏ ͏ ͏ ͏ ͏ ͏ ͏ ͏ ͏ ͏ ͏ ͏ ͏ ͏ ͏ ͏ ͏ ͏ ͏ ͏ ͏ ͏ ͏ ͏ ͏ ͏ ͏ ͏ ͏ ͏ ͏ ͏ ͏ ͏ ͏ ͏ ͏ ͏ ͏ ͏ ͏ ͏ ͏ ͏ ͏ ͏ ͏ ͏ ͏ ͏ ͏ ͏ ͏ ͏ ͏ ͏ ͏ ͏ ͏ ͏ ͏ ͏
join me: 6 trends shaping the AI landscape in 2025
Friday, February 14, 2025
this is tomorrow Hi there, Isabelle here, Senior Editor & Analyst at CB Insights. Tomorrow, I'll be breaking down the biggest shifts in AI – from the M&A surge to the deals fueling the
Six Startups to Watch
Friday, February 14, 2025
AI wrappers, DNA sequencing, fintech super-apps, and more. ͏ ͏ ͏ ͏ ͏ ͏ ͏ ͏ ͏ ͏ ͏ ͏ ͏ ͏ ͏ ͏ ͏ ͏ ͏ ͏ ͏ ͏ ͏ ͏ ͏ ͏ ͏ ͏ ͏ ͏ ͏ ͏ ͏ ͏ ͏ ͏ ͏ ͏ ͏ ͏ ͏ ͏ ͏ ͏ ͏ ͏ ͏ ͏ ͏ ͏ ͏ ͏ ͏ ͏ ͏ ͏ ͏ ͏ ͏ ͏ ͏ ͏ ͏ ͏ ͏ ͏ ͏ ͏ ͏ ͏ ͏
How Will AI-Native Games Work? Well, Now We Know.
Friday, February 14, 2025
A Deep Dive Into Simcluster ͏ ͏ ͏ ͏ ͏ ͏ ͏ ͏ ͏ ͏ ͏ ͏ ͏ ͏ ͏ ͏ ͏ ͏ ͏ ͏ ͏ ͏ ͏ ͏ ͏ ͏ ͏ ͏ ͏ ͏ ͏ ͏ ͏ ͏ ͏ ͏ ͏ ͏ ͏ ͏ ͏ ͏ ͏ ͏ ͏ ͏ ͏ ͏ ͏ ͏ ͏ ͏ ͏ ͏ ͏ ͏ ͏ ͏ ͏ ͏ ͏ ͏ ͏ ͏ ͏ ͏ ͏ ͏ ͏ ͏ ͏ ͏ ͏ ͏ ͏ ͏ ͏ ͏ ͏ ͏ ͏ ͏ ͏ ͏ ͏ ͏ ͏

