Refining strategy with Wardley Mapping. @ Irrational Exuberance
Hi folks,
This is the weekly digest for my blog, Irrational Exuberance. Reach out with thoughts on Twitter at @lethain, or reply to this email.
Posts from this week:
-
Refining strategy with Wardley Mapping.
Refining strategy with Wardley Mapping.
The first time I heard about Wardley Mapping was from Charity Majors discussing it on Twitter. Of the three core strategy refinement techniques, this is the technique that I’ve personally used the least. Despite that, I decided to include it in this book because it highlights how many different techniques can be used for refining strategy, and also because it’s particularly effective at looking at the broadest ecosystems your organization exists in.
Where the other techniques like systems thinking and strategy testing often zoom in, Wardley mapping is remarkably effective at zooming out.
In this chapter, we’ll cover:
- A ten-minute primer on Wardley mapping
- Recommendations for tools to create Wardley maps
- When Wardley maps are an ideal strategy refinement tool, and when they’re not
- The process I use to map, as well as integrate a Wardley map into strategy creation
- Breadcrumbs to specific Wardley maps that provide examples
- Documenting a Wardley map in the context of a strategy writeup
- Why I limited focus on two elements of Wardley’s work: doctrines and gameplay
After working through this chapter, and digging into some of this book’s examples of Wardley Maps, you’ll have a good background to start your own mapping practice.
This is an exploratory, draft chapter for a book on engineering strategy that I’m brainstorming in #eng-strategy-book. As such, some of the links go to other draft chapters, both published drafts and very early, unpublished drafts.
Ten minute primer
Wardley maps are a technique created by Simon Wardley to ensure your strategy is grounded in reality. Or, as mapping practioners would say, it’s a tool for creating situational awareness. If you have a few days, you might want to start your dive into Wardley mapping by reading Simon Wardley’s book on the topic, Wardley Maps. If you only have ten minutes, then this section should be enough to get you up to speed on reading Wardley maps.
Picking an example to work through, we’re going to create a Wardley map that aims to understand a knowledge base management product, along the lines of a wiki like Confluence or Notion.
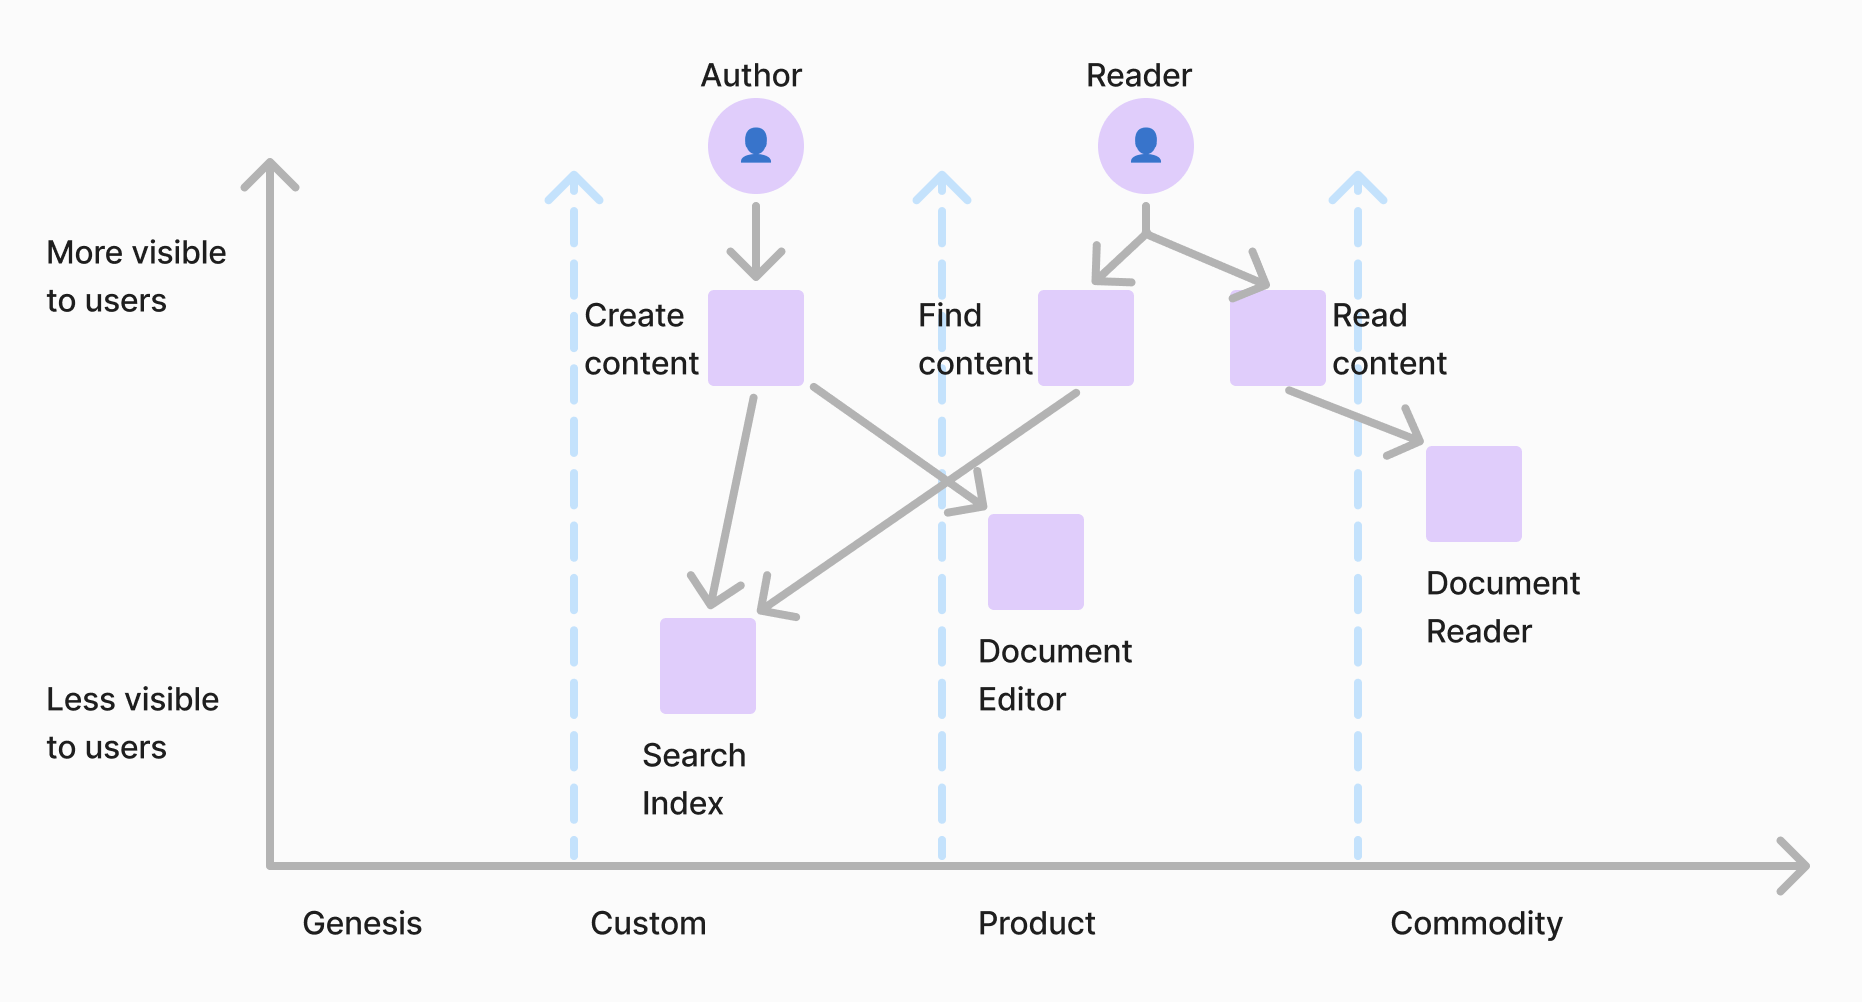
You need to know three foundational concepts to read a Wardley map:
-
Maps are populated with three kinds of components: users, needs, and capabilities. Users exist at the top, and represent a cohort of users who will use your product. Each kind of user has a specific set of needs, generally tasks that they need to accomplish. Each need requires certain capabilities required to fulfill that need.
Any box connecting directly to a user is a need. Any box connecting to a need is a capability. A capability can be connected to any number of needs, but can never connect directly to a user; they connect to users only indirectly via a need.
-
The x-axis is divided into four segments, representing how commoditized a capability is. On the far left is genesis, which represents a brand-new capability that hasn’t existed before. On the far right is commoditized, something so standard and expected that it’s unremarkable, like turning on a switch causing electricity to flow. In between are custom and product, the two categories where most items fall on the map. Custom represents something that requires specialized expertise and operation to function, such as a web application that requires software engineers to build and maintain. Product represents something that can generally be bought.
In this map, document reading is commoditized: it’s unremarkable if your application allows its users to read content. On the other hand, document editing is someone on the border of product and custom. You might integrate an existing vendor for document editing needs, or you might build it yourself, but in either case document editing is less commoditized than document reading.
-
The y-axis represents visibility to the user. In this map, reading documents is something that is extremely visible to the user. On the other hand, users depend on something indexing new documents for search, but your users will generally have no visibility into the indexing process or even that you have a search index to begin with.
Although maps can get quite complex, those three concepts are generally sufficient to allow you to decode an arbitrarily complex map.
In addition to mapping the current state, Wardley maps are also excellent at exploring how circumstances might change over time. To illustrate that, let’s look at a second iteration of our map, paying particular attention to the red arrows indicating capabilities that we expect to change in the future.
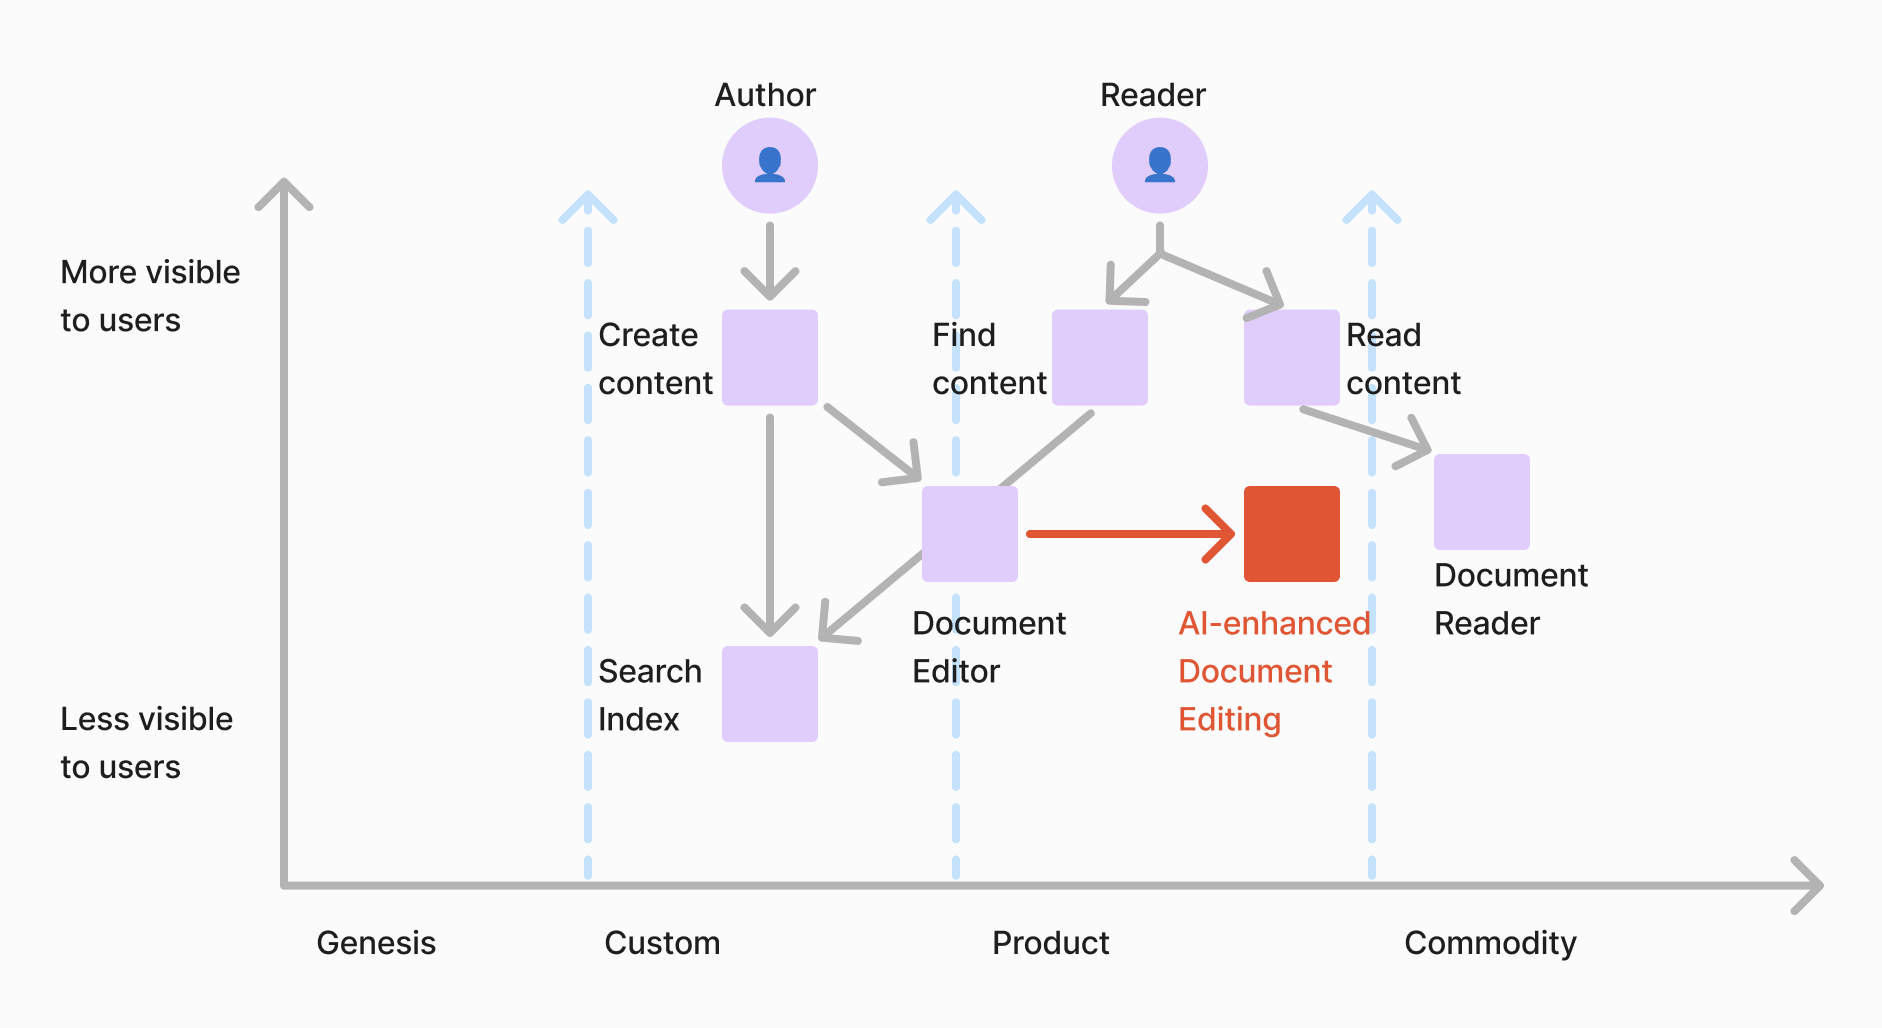
In particular, the map now indicates that the current document creation experience will be superseded by an AI-enhanced editing process. Critically, the map also predicts that the AI-enhanced process will be more commoditized than its current authoring experience, perhaps because the AI-enhancement will be driven by commoditized foundational models from providers like Anthropic and OpenAI. Building on that, the only place left in the map for meaningful differentiation is in search indexing. Either the knowledge base company needs to accept the implication that they will increasingly be a search company, or they need to expand the user needs they service to find a new avenue for differentiation.
Some maps will show evolution of a given capability using a “pipeline”, a box that describes a series of expected improvements in a capability over time.
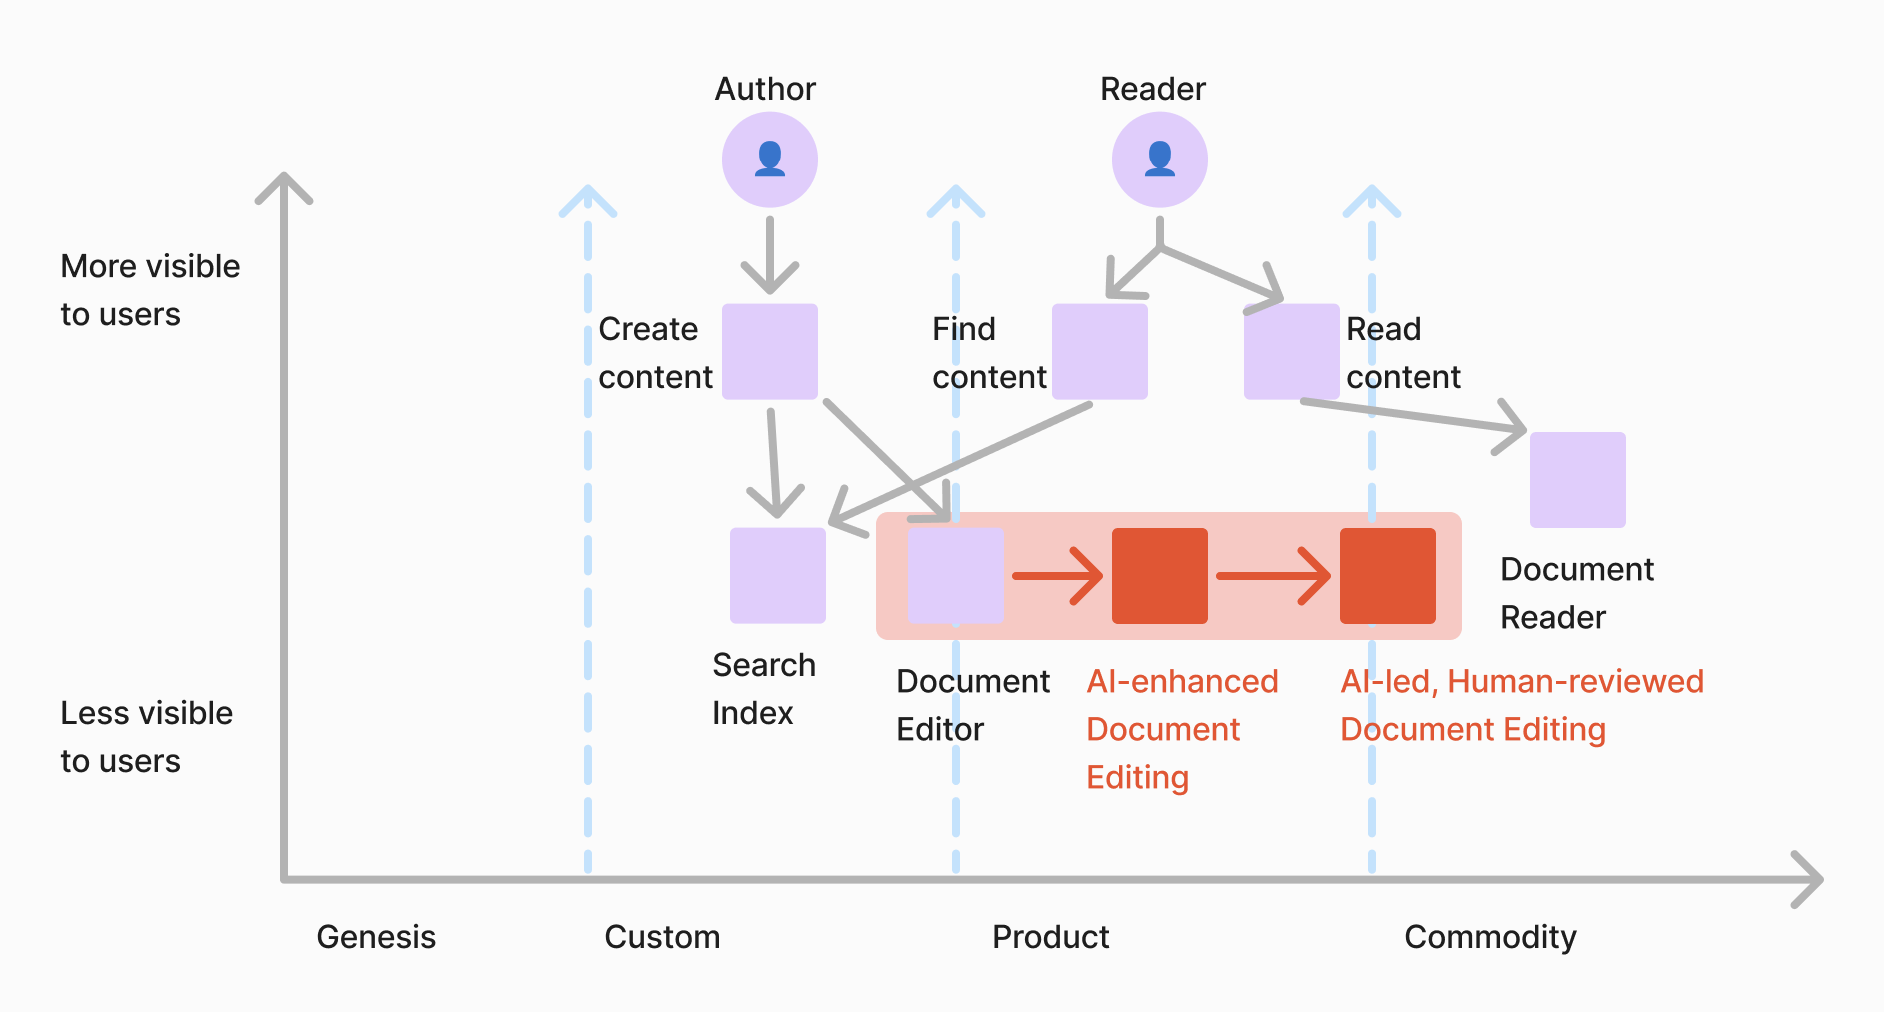
Now instead of simply indicating that the authoring experience may be replaced by an AI-enhanced capability over time, we’re able to express a sequence of steps. From the starting place of a typical editing experience, the next expected step is AI-assisted creation, and then finally we expect AI-led creation where the author only provides high-level direction to a machine learning-powered agent.
For completeness, it’s also worth mentioning that some Wardley maps will have an overlay, which is a box to group capabilities or requirements together by some common denominator. This happens most frequently to indicate the responsible team for various capabilities, but it’s a technique that can be used to emphasize any interesting element of a map’s topology.
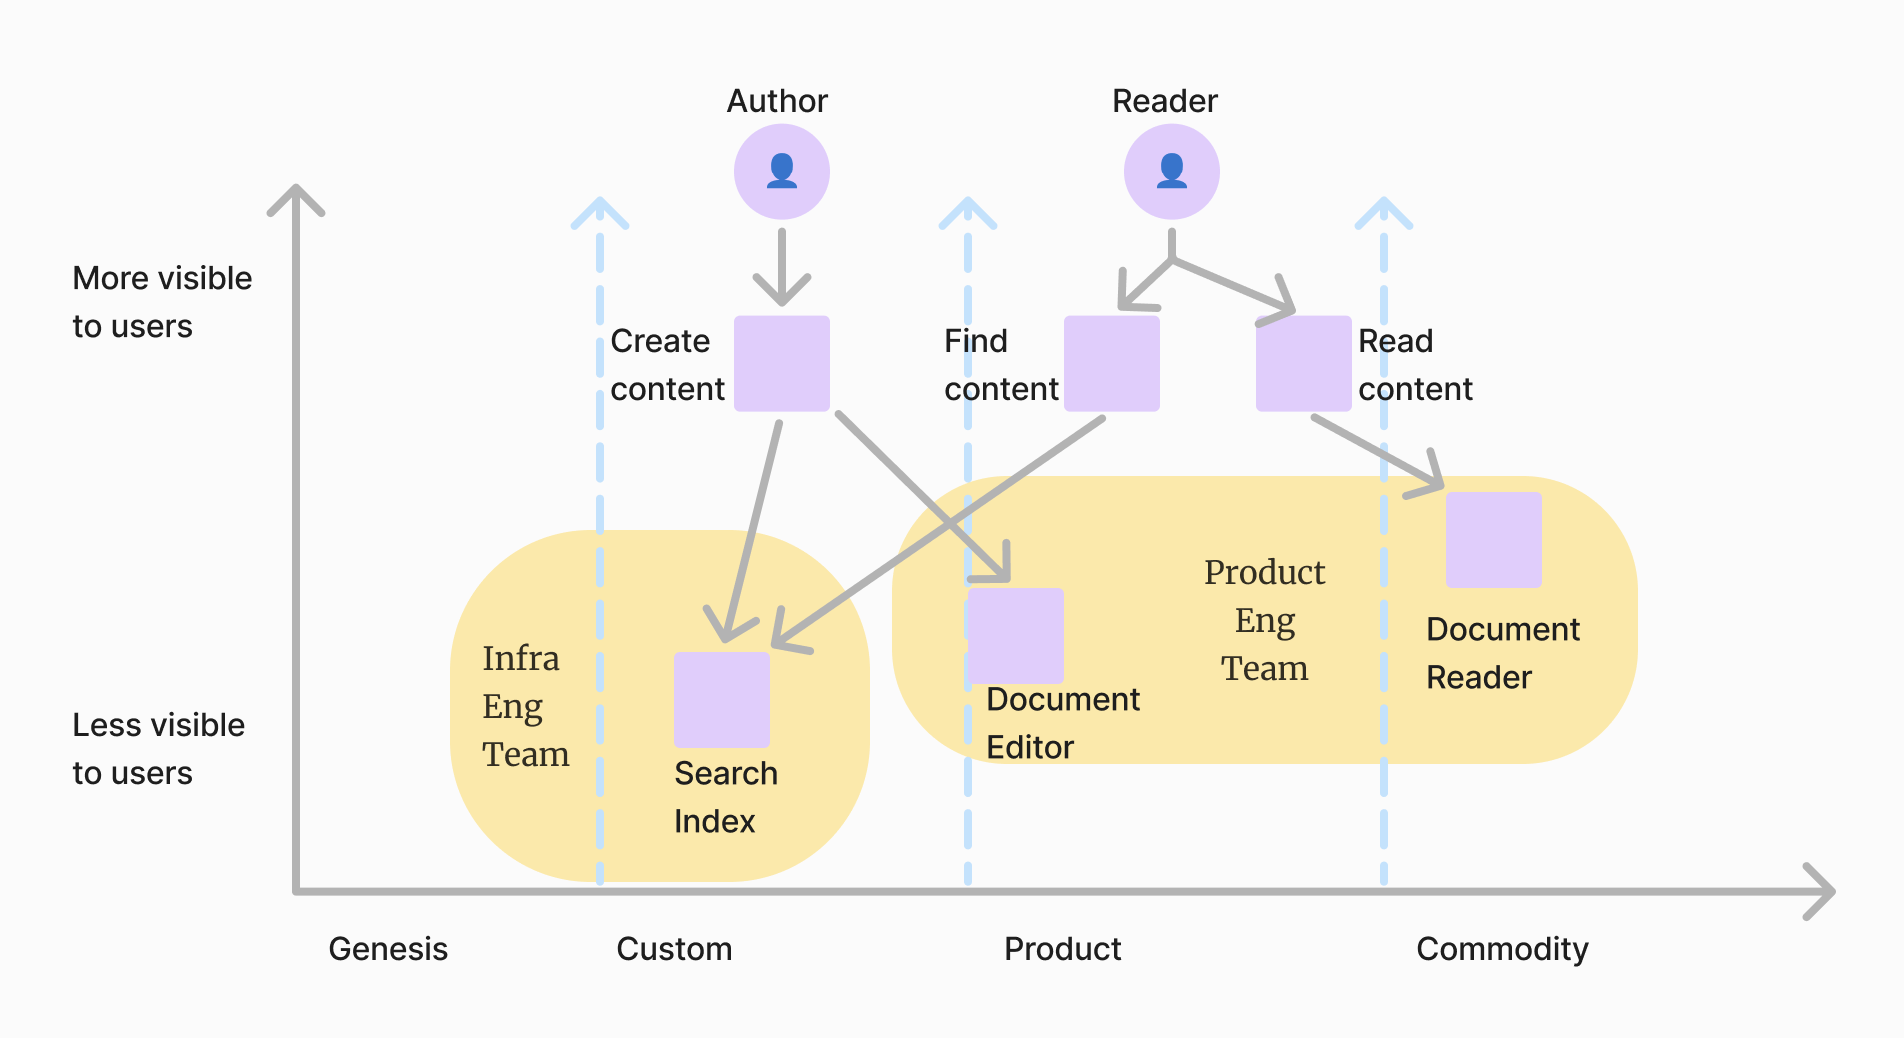
At this point, you have the foundation to read a Wardley map, or get started creating your own. Maps you encounter in the wild might appear singificantly more complex than these initial examples, but they’ll be composed of the same fundamental elements.
More Wardley Mapping resources
The Value Flywheel Effect by David Anderson
Wardley Maps by Simon Wardley on Medium, also available as PDF
Learn Wardley Mapping by Ben Mosior
Tools for Wardley Mapping
Systems modeling has a serious tooling problem, which often prevents would-be adopters from developing their systems modeling practice. Fortunately, Wardley Mapping doesn’t suffer from that problem. Uou can simply print out a Wardley Map and draw on it by hand. You can also use OmniGraffle, Miro, Figma or whatever diagramming tool you’re already familiar with.
There are more focused tools as well, with Ben Mosior pulling together an excellent writeup on Wardley Mapping Tools as of 2024. Of those two, I’d strongly encourage starting with Mapkeep as a simple, free, and intuitive tool for your innitial mapping needs.
After you’ve gotten some practice, you may well want to move back into your most familiar diagramming tool to make it easier to collaborate with colleagues, but initially prioritize the simplest tool you can to avoid losing learning momentum on configuration, setup and so on.
When are Wardley Maps useful?
All successful strategy begins with understanding the constraints and circumstances that the strategy needs to work within. Wardley mapping labels that understanding as situational awareness, and creating situational awareness is the foremost goal of mapping.
Situational awareness is always useful, but it’s particularly essential in highly dynamic environments where the industry around you, competitors you’re sellinga gainst, or the capabilities powering your product are shifting rapidly. In the past several decades, there have been a number of these dynamic contexts, including the rise of web applications, the proliferation of mobile devices, and the expansion of machine learning techniques.
When you’re in those environments, it’s obvious that the world is changing rapidly. What’s sometimes easy to miss is that any strategy the needs to last longer than a year or two is build on an evolving foundation, even if things seem very stable at the time. For example, in the early 2010s, startups like Facebook, Uber and Digg were all operating in physical datacenters with their owned hardware. Over a five year period, having a presence in a physical datacenter went from the default approach for startups to a relatively unconventional solution, as cloud based infrastructure rapidly expanded. Any strategy written in 2010 that imagined the world of hosting was static, was destinated to be invalidated.
No tool is universally effective, and that’s true here as well. While Wardley maps are extremely helpful at understanding broad change, my experience is that they’re less helpful in the details. If you’re looping to optimize your onboarding funnel, then something like systems modeling or strategy testing are likely going to serve you better.
How to Wardley Map
Learning Wardley mapping is a mix of reading others’ maps and writing your own. A variety of maps for reading are collected in the following breadcrumbs section, and I’d recommend skimming all of them. In this section are the concrete steps I’d encourage you to follow for creating the first map of your own:
-
Commit to starting small and iterating. Simple maps are the foundation of complex maps. Even the smallest Wardley map will have enough detail to reveal something interesting about the environment you’re operating in.
Conversely, by starting complex, it’s easy to get caught up in all of your early map’s imperfections. At worst, this will cause you to lose momentum in creating the map. At best, it will accidentally steer your attention rather than facilitating discover of which details are important to focus on.
-
List users, needs and capabilities. Identify the first one or two users for your product. Going back to the knowledge management example from the primer, your two initial users might be an author and a reader. From there, identify those users’ needs, such as authoring content, finding content, and providing feedback on which content is helpful. Finally, write down the underlying technical capabilities necessary to support those needs, which might range from indexing content in a search index to a customer support process to deal with frustrated users.
Remember to start small! On your first pass, it’s fine to focus on a single user. As you iterate on your map, bring in more users, needs and capabilities until the map conveys something useful.
Tooling for this can be a piece of paper or wherever you keep notes.
-
Establish value chains. Take your list and then connect each of the components into chains. For example, the reader in the above knowledge base example would then be connected to needing to discover content. Discovering content would be linked to indexing in the search index. That sequence from reader to discovering content to search index represents one value chain.
Convergence across chains is a good thing. As your chains get more comprehensive, it’s expected that a given capability would be referenced by multiple different needs. Similarly, it’s expected that multiple users might have a shared need.
-
Plot value chains on a Wardley Map. You can do this using any of the tools discussed in the Tools for Wardley mapping section, including a piece of paper.
Because you already have the value chains created, what you’re focused on in this step is placing each component relative to it’s visibility to users (higher up is more visible to the user, lower down is less visible), and how mature the solutions are (leftward represents more custom solutions, rightward represents most commoditized solutions).
-
Study current state of the map. With the value chains plotted on your map, it will begin to reveal where your organization’s attention should be focused, and what complexity you can delegate to vendors. Jot down any realizations you have from this topology.
-
Predict evolution of the map, and create a second version of your map that includes these changes. (Keep the previous version so you can better see the evolution of your thinking!)
It can be helpful to create multiple maps that contemplate different scenarios. Thinking about the running knowledge base example, you might contemplate a future where AI-powered tools become the dominant mechanism for authors creating content. Then you could explore another future where such tools are regulated out of most tools, and imagine how that would shape your approach differently.
Picking the timeframe for these changes will vary on the evironment you’re mapping. Always prefer a timeframe that makes it easy to believe changes will happen, maybe that’s five years, or maybe it’s 12 months. If you’re caught up wondering whether change might take longer a certain timeframe, than simply extend your timeframe to sidestep that issue.
-
Study future state of the map, now that you’ve predicted the future, Once again, write down any unexpected implications of this evolution, and how you may need to adjust your approach as a result.
-
Share with others for feedback. It’s impossible for anyone to know everything, which is why the best maps tend to be a communal creation. That’s not to suggest that you should perform every step in a broad community, or that your map should be the consensus of a working group. Instead, you should test your map against others, see what they find insightful and what they find artificial in the map, and include that in your map’s topology.
-
Document what you’ve learned as discussed below in the section on documentation. You should also connect that Wardley map writeup with your overall strategy document, typically in the Refine or Explore sections.
One downside of presenting steps to do something is that the sequence can become a fixed recipe. These are the steps that I’ve found most useful, and I’d encourage you to try them if mapping is a new tool in your toolkit, but this is far from the canonical way. Start here, then experiment with other approaches until you find the best approach for you and the strategies that you’re working on.
Breadcrumbs for Wardley Map examples
I’ll update these examples as I continue writing more strategies for this book. Until then, I admit that some of these examples are “what I have laying around” moreso than the “ideal forms of Wardley maps.”
With the foundation in place, the best way to build on Wardley mapping is writing your own maps. The second best way is to read existing maps that others have made, and a number of which exist within this book:
- LLM evolution studies the evolution of the Large Language Model ecosystem, and how that will impact product engineering organizations attempting to validate and deploy new paradigms like agentic workflows and retrieval augmented generation
- Gitlab strategy shows a broad Wardley Map, looking at the developer tooling industry’s evolution over time, and how Gitlab’s approach implies they belief commoditization will drive organizations to prefer bundled solutions over integration best-in-breed offerings
- Evolution of developer experience tooling space explores how Wardley mapping has helped me refine my understanding of how the developer experience ecosystem will evolve over time
In addition to the maps within this book, I also label maps that I create on my blog using the wardley category.
How to document a Wardley Map
As explored in how to create readable strategy documents, the default temptation is to structure documents around the creation process. However, it’s essentially always better to write in two steps: develop a writing-optimization version that’s focused on facilitating thinking, and then rework it into a reading-optimized version that supports both readers who are, and are not, interested in the details.
The writing-optimized version is what we discussed in “How to Wardley Map” above. For a reading-optimized version, I recommend:
-
How things work today shares a map of the current environment, explains any interesting rationales or controversies behind placements on the map, and highlights the most interesting parts of the map
-
Transition to future state starts with a second map, this one showing the transition from the current state to a projected future state. It’s very reasonable to have multiple distinct maps, each of which considers one potential evolution, or one step of a longer evolution.
-
Users and Value chains are the first place you start creating a Wardley map, but generally the least interesting part of explaining a map’s implications. This isn’t because the value chains are unimportant, rather it’s because the map itself tends to implicitly explain the value chain enough that you can move directly to focusing on the map’s most interesting implications.
In a sufficiently complex, it’s very reasonable to split this into two sections, but generally I find it eliminates redundency to cover users and value chains in one joint section rather than separately. This is a good example of the difference between reading and writing: splitting these two topics helps clarify thinking, but muddles reading.
This ordering may seem too brief or a bit counter-intuitive for you, as the person who has the full set of details, but my experience is that it will be simpler to read for most readers. That’s because most readers read until they agree with the conclusion, then stop reading, and are only interested in the details if they disagree with the conclusion.
This format is also fairly different than the format I recommend for documenting systems models. That is because systems model diagrams exclude much of the relevant detail, showing the relationship between stocks but not showing the magnitude of the flows. You can only fully understand a system model by seeing both the diagram and a chart showing the model’s output. Wardley maps, on the other hand, tend to be more self-explanatory, and often can stand on their own with relatively less written description.
What about doctrines and gameplay?
This book’s components of strategy are most heavily influenced by Richard Rumelt’s approach. Simon Wardley’s approach to strategy built around Wardley Mapping could be viewed as a competing lens. For each problem that Rumelt’s system solves, there is a Wardley solution as well, and it’s worth mentioning some of the components I’ve not included, and why I didn’t.
The two most important components I’ve not discussed thus far are Wardley’s ideas of doctrine and gameplay. Wardley’s doctrine are universally applicable practices like knowing your users, biasing towards data, and design for constant evolution. Gameplay is similar to doctrine, but is context-dependent rather than universal. Some examples of gameplay are talent raid (hiring from knowledgable competitior), bundling (selling products together rather than separately), and exploiting network effects.
I decided not to spend much time on doctrine and gameplay because I find them lightly specialized on the needs of business strategy, and consequently a bit messy to apply to the sorts of problems that this book is most interested in solving: the problems of engineering strategy.
To be explicit, I don’t personally view Rumelt’s approach and Wardley’s approaches as competing efforts. What’s most valuable is to have a broad toolkit, and pull in the pieces of that toolkit that feel most applicable to the problems at hand. I find Wardley Maps exceptionally valuable at enhancing exploration, diagnosis, and refinement in some problems. In other problems, typically shorter duration or more internally-oriented, I find the Rumelt playbook more applicable. In all problems, I find the combination more valuable than anchoring in one camp’s perspective.
Summary
No refinement technique will let you reliably predict the future, but Wardley mapping is very effective at helping you plot out the various potential futures your strategy might need to operate in. With those futures in mind, you can tune your strategy to excel in the most likely, and to weather the less desirable.
It took me years to dive into Wardley mapping. Once I finally did, it was simpler than I’d feared, and now I find myself creating Wardley maps somewhat frequently. When you’re working on your next strategy that’s impacted by the ecosystem’s evolution around it, try your hand at mapping, and soon you’ll start to build your own collection of maps.
That's all for now! Hope to hear your thoughts on Twitter at @lethain!
|
Older messages
How to effectively refine engineering strategy. @ Irrational Exuberance
Wednesday, January 1, 2025
Hi folks, This is the weekly digest for my blog, Irrational Exuberance. Reach out with thoughts on Twitter at @lethain, or reply to this email. Posts from this week: - How to effectively refine
Wardley mapping the LLM ecosystem. @ Irrational Exuberance
Wednesday, December 25, 2024
Hi folks, This is the weekly digest for my blog, Irrational Exuberance. Reach out with thoughts on Twitter at @lethain, or reply to this email. Posts from this week: - Wardley mapping the LLM ecosystem
2024 in review. @ Irrational Exuberance
Thursday, December 19, 2024
Hi folks, This is the weekly digest for my blog, Irrational Exuberance. Reach out with thoughts on Twitter at @lethain, or reply to this email. Posts from this week: - 2024 in review. 2024 in review. A
Measuring developer experience, benchmarks, and providing a theory of improvement. @ Irrational Exuberance
Wednesday, December 11, 2024
Hi folks, This is the weekly digest for my blog, Irrational Exuberance. Reach out with thoughts on Twitter at @lethain, or reply to this email. Posts from this week: - Measuring developer experience,
Rough notes on learning Wardley Mapping. @ Irrational Exuberance
Tuesday, December 10, 2024
Hi folks, This is the weekly digest for my blog, Irrational Exuberance. Reach out with thoughts on Twitter at @lethain, or reply to this email. Posts from this week: - Rough notes on learning Wardley
You Might Also Like
3-2-1: On the secret to self-control, how to live longer, and what holds people back
Thursday, February 27, 2025
“The most wisdom per word of any newsletter on the web.” 3-2-1: On the secret to self-control, how to live longer, and what holds people back read on JAMESCLEAR.COM | FEBRUARY 27, 2025 Happy 3-2-1
10 Predictions for the 2020s: Midterm report card
Thursday, February 27, 2025
In December of 2019, which feels like quite a lifetime ago, I posted ten predictions about themes I thought would be important in the 2020s. In the immediate weeks after I wrote this post, it started
Ahrefs’ Digest #220: Hidden dangers of programmatic SEO, Anthropic’s SEO strategy, and more
Thursday, February 27, 2025
Welcome to a new edition of the Ahrefs' Digest. Here's our meme of the week: — Quick search marketing news Google Business Profile now explains why your verification fails. Google launches a
58% of B2B Buyers Won't Consider You.
Thursday, February 27, 2025
Here's why, and how to fix it. ͏ ͏ ͏ ͏ ͏ ͏ ͏ ͏ ͏ ͏ ͏ ͏ ͏ ͏ ͏ ͏ ͏ ͏ ͏ ͏ ͏ ͏ ͏ ͏ ͏ ͏ ͏ ͏ ͏ ͏ ͏ ͏ ͏ ͏ ͏ ͏ ͏ ͏ ͏ ͏ ͏ ͏ ͏ ͏ ͏ ͏ ͏ ͏ ͏ ͏ ͏ ͏ ͏ ͏ ͏ ͏ ͏ ͏ ͏ ͏ ͏ ͏ ͏ ͏ ͏ ͏ ͏ ͏ ͏ ͏ ͏ ͏ ͏ ͏ ͏ ͏ ͏ ͏ ͏ ͏ ͏ ͏ ͏
Teleportation, AI Innovation, and Outgrowing 'Good Enough'
Thursday, February 27, 2025
Oxford scientists have achieved quantum teleportation of logic gates, AI advances include France's €109B investment, Unitree's eerily smooth robotic movements, and DeepMind's Veo2 video
🧙♂️ Quick question
Thursday, February 27, 2025
Virtual dry-run of my event ͏ ͏ ͏ ͏ ͏ ͏ ͏ ͏ ͏ ͏ ͏ ͏ ͏ ͏ ͏ ͏ ͏ ͏ ͏ ͏ ͏ ͏ ͏ ͏ ͏ ͏ ͏ ͏ ͏ ͏ ͏ ͏ ͏ ͏ ͏ ͏ ͏ ͏ ͏ ͏ ͏ ͏ ͏ ͏ ͏ ͏ ͏ ͏ ͏ ͏ ͏ ͏ ͏ ͏ ͏ ͏ ͏ ͏ ͏ ͏ ͏ ͏ ͏ ͏ ͏ ͏ ͏ ͏ ͏ ͏ ͏ ͏ ͏ ͏ ͏ ͏ ͏ ͏ ͏ ͏ ͏ ͏ ͏ ͏ ͏ ͏ ͏
A Classical Way to Save the Whales
Thursday, February 27, 2025
But what song, we don't know.
I'm investing in early stage AI startups
Thursday, February 27, 2025
Hi all, I'm investing in early stage AI startups. If you know someone who's looking for easy-to-fit-in checks from helpful founders (happy to provide references) I'd love to chat. Trevor
🧙♂️ [NEW] 7 Paid Sponsorship Opportunities
Thursday, February 27, 2025
Plus secret research on La-Z-Boy, Android, and OSEA Malibu ͏ ͏ ͏ ͏ ͏ ͏ ͏ ͏ ͏ ͏ ͏ ͏ ͏ ͏ ͏ ͏ ͏ ͏ ͏ ͏ ͏ ͏ ͏ ͏ ͏ ͏ ͏ ͏ ͏ ͏ ͏ ͏ ͏ ͏ ͏ ͏ ͏ ͏ ͏ ͏ ͏ ͏ ͏ ͏ ͏ ͏ ͏ ͏ ͏ ͏ ͏ ͏ ͏ ͏ ͏ ͏ ͏ ͏ ͏ ͏ ͏ ͏ ͏ ͏ ͏ ͏ ͏ ͏ ͏ ͏ ͏
• Relax with a Great Book • Book Deals • Free • KU • Paperback •
Thursday, February 27, 2025
Reading Deals Here! Fiction and Non-fiction Book Deals for You! ContentMo's Books Newsletter
