The Knowledge Worker - Scare Yourself Enough to Change
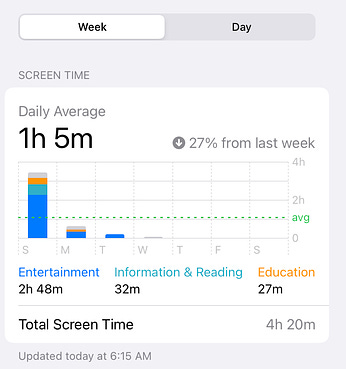
Scare Yourself Enough to ChangeMake your usage visible with Screen Time, Digital Wellbeing, and RizeBefore Google and Apple cared about scree time, Tim Kendall co-founded Moment. Moment tracked usage with two primary metrics; the number of unlocks and total interaction time. By tracking interaction time, Moment removed the poor excuse of blaming your high screen time on idle unlocks because in order for screen time to count toward usage, you had to be interacting with the device- scrolling or opening apps, to be more precise. The app also allowed you to set a daily target goal for total usage. When you got close to exceeding that limit, Moment would notify you, which was your cue to stop using the device. Daily and weekly reports also helped nudge you towards better usage behavior. Each report showed you a breakdown of where your time was going and if you met your self-defined goals which subtly shamed you if you didn’t meet those goals. Sadly, Moment is no more. Nicat Manafov is a UI/UX designer who followed the company. He informed me that “In one day the company website disappeared from the internet. The app vanished from the App Store without any announcement or explanation.” For some strange reason, all that remains is the company’s YouTube channel and LinkedIn profile. Luckily, in the time since Moment pioneered the space, both Google and Apple have released built-in usage trackers. iOS has Screen Time and Android has Digital Wellbeing. Both apps track usage, notifications, and pickups. All of which are valuable sources of information. Usage data brings to light how much of your time is being eaten up by a specific app and/or device. Notifications paint the picture of how intrusive a device is. And pickups are an indicator of how irresistible the device is to you. Both Screen Time and Digital Wellbeing come pre-installed and are enabled by default. To view your usage all you need to do is find the app within your Settings or System Preferences for macOS users. Both apps provide daily and weekly reports, much like Moment did. What Screen Time Tells YouOn the weekly report, you get a breakdown of your Daily Average, along with a percent of the increase or decrease from last week’s metrics. Usage data is represented in a graph that breaks it down by each day of the week. Your usage for the entire week is displayed under the bar graph and bucketed by your top three categories of usage. Total Screen Time for the week is then listed at the bottom of the graph.
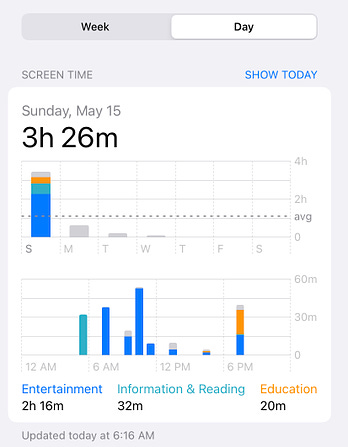
Switching tabs at the top to Day, presents you with a finer view of your usage. The top display box displays the total Screen Time for the Day, two bar graphs, and the top three categories. The first bar graph displays the days of the week along the x-axis and total Screen Time on the y-axis, giving you a snapshot of each day.
Below the total Screen Time bar graph is a second graph. On the second graph, the hours of the day are on the X-axis and the minutes on the Y-axis. The top three categories of your usage are then plotted on the graph. Which gives you an idea of when and how much you've used a specific app. Scrolling down a bit, another screen title
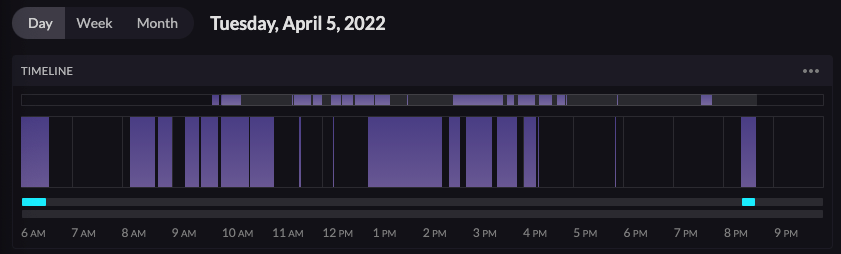
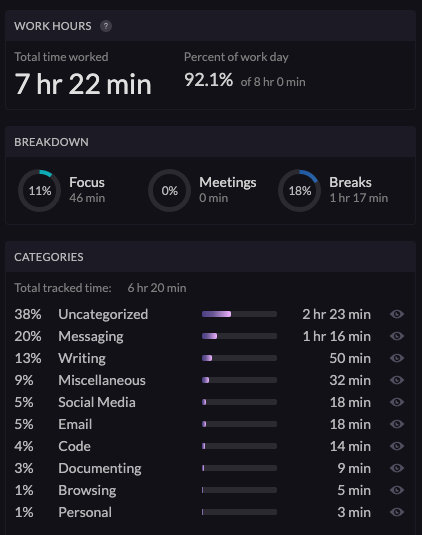
Pickups provide insights into how addicted and distracted you are. The more pickups you have and the closer they are together is an indicator of how much pull the device has over you. Where Screen Time and Digital Wellbeing fall short is historical data, cross-device tracking, and usage granularity. At most, these apps present a single week’s worth of data. That just isn’t enough historical reference to catch most behavior addictions. Another limitation is the blind spots created by the abstraction of grouping your usage into a category or an application. For example, knowing you spent two hours using a web browser isn’t all that useful. In order to correct your behavior, you’d have to know what websites you visited and how long you spent there. Screen Time pulls in some of that data, but it’s just not granular enough to be useful. Lately, if you’re not exclusively an Apple consumer you won’t be able to track your usage across all your devices. Get Historical and Granular Insights with RizeRize provides the historical data and granularity you need. It's a smart time tracker that helps you make data-based decisions to build better habits. Unlike ScreenTime and Digital Wellbeing, Rize tracks everything. Every activity you do on your computer is logged and time-stamped, which gives the program the ability to calculate the total time you used a particular app or visited a specific website. Armed with this type of data, you can truly make the invisible visible. Beyond just logging activity, Rize also plots your usage throughout the day on a timeline, giving you a glimpse into your high-level usage pattern. It provides the timeline view for a single day, week, or month. We like to think that our usage is confined to our working hours, but data will likely tell you a different story, the truth. Your usage is fragmented throughout every moment of your day.
Rize also categorizes your activity for you, which takes some massaging to make accurate. But, with a little effort can begin to surface your bad or good habits.
Download and Install Rize
Downloading the app requires nothing more than your email address. No credit card is required and there’s a 14-day free trial included. Which is more than enough for our purposes. Use Rize and Screen Time or Digital Wellbeing to track your usage for seven days. Do your best not to alter any of your behavior. Don’t worry about exhausting your willpower trying not to pick up your phone or limit your usage, that comes later. For now, just track where your attention goes and your time will follow.
© 2022 Josh Duffney Unsubscribe
|


Older messages
How do you plan your day?
Thursday, January 20, 2022
What personal productivity system do you use to keep a handle on life? What have you used in the past? And what has stuck the longest and why?
Escape your inbox
Saturday, January 15, 2022
10 lessons from Cal Newports “A World Without Email"
Books I read in 2021
Saturday, January 1, 2022
and why you might want to consider reading them too
Note-taking became a full-time job, so I stopped
Saturday, December 18, 2021
Why I take dumb notes instead of smart ones
I'm back!👋 AMA
Wednesday, December 15, 2021
Just writing books and recording YouTube videos was a terrible idea… 😅 I paused the newsletter to focus on completing Reclaim. It worked, sorta…
You Might Also Like
3-2-1: The power of limiting your options, the value of eagerness, and what we undervalue
Thursday, November 21, 2024
3 ideas, 2 quotes, and 1 question to consider this week. ͏ ͏ ͏ ͏ ͏ ͏ ͏ ͏ ͏ ͏ ͏ ͏ ͏ ͏ ͏ ͏ ͏ ͏ ͏ ͏ ͏ ͏ ͏ ͏ ͏ ͏ ͏ ͏ ͏ ͏ ͏ ͏ ͏ ͏ ͏ ͏ ͏ ͏ ͏ ͏ ͏ ͏ ͏ ͏ ͏ ͏ ͏ ͏ ͏ ͏ ͏ ͏ ͏ ͏ ͏ ͏ ͏ ͏ ͏ ͏ ͏ ͏ ͏ ͏ ͏ ͏ ͏ ͏ ͏ ͏ ͏ ͏
🤯 You Will Be Left Behind (Unless You Learn These 10 Truths)
Thursday, November 21, 2024
PLUS: Live event. Big lessons. Huge prizes (for everyone) 10 Hard Truths You'll Need to Build Wealth Contrarians, Last week, we teased you with the biggest ownership event of the decade — the Main
Ahrefs’ Digest #210: Google manual actions, fake AI profiles, and more
Thursday, November 21, 2024
Welcome to a new edition of the Ahrefs' Digest. Here's our meme of the week: — Quick search marketing news ICYMI, Google is rolling out the November 2024 Core Update. Google quietly introduces
Closes Sunday • Black Fri TO CyberMon Book Promos for Authors
Thursday, November 21, 2024
Book Your Spot Now to Get Seen During the Busiest Shopping Season of the Year! Please enable images to see this email. Black Friday & Cyber
What Motivates Marketers? The Answers Will Shock You 🫢
Thursday, November 21, 2024
We surveyed marketers across the globe - here's what they say. ͏ ͏ ͏ ͏ ͏ ͏ ͏ ͏ ͏ ͏ ͏ ͏ ͏ ͏ ͏ ͏ ͏ ͏ ͏ ͏ ͏ ͏ ͏ ͏ ͏ ͏ ͏ ͏ ͏ ͏ ͏ ͏ ͏ ͏ ͏ ͏ ͏ ͏ ͏ ͏ ͏ ͏ ͏ ͏ ͏ ͏ ͏ ͏ ͏ ͏ ͏ ͏ ͏ ͏ ͏ ͏ ͏ ͏ ͏ ͏ ͏ ͏ ͏ ͏ ͏ ͏ ͏
🧙♂️ NEW 8 Sponsorship Opportunities
Thursday, November 21, 2024
Plus secret research on SoFi, Angara Jewelry, and Dyson ͏ ͏ ͏ ͏ ͏ ͏ ͏ ͏ ͏ ͏ ͏ ͏ ͏ ͏ ͏ ͏ ͏ ͏ ͏ ͏ ͏ ͏ ͏ ͏ ͏ ͏ ͏ ͏ ͏ ͏ ͏ ͏ ͏ ͏ ͏ ͏ ͏ ͏ ͏ ͏ ͏ ͏ ͏ ͏ ͏ ͏ ͏ ͏ ͏ ͏ ͏ ͏ ͏ ͏ ͏ ͏ ͏ ͏ ͏ ͏ ͏ ͏ ͏ ͏ ͏ ͏ ͏ ͏ ͏ ͏ ͏ ͏ ͏
Literature Lab vol. 1 - Rebecca Makkai | #122
Thursday, November 21, 2024
Fiction: I Have Some Questions for You by Rebecca Makkai ͏ ͏ ͏ ͏ ͏ ͏ ͏ ͏ ͏ ͏ ͏ ͏ ͏ ͏ ͏ ͏ ͏ ͏ ͏ ͏ ͏ ͏ ͏ ͏ ͏ ͏ ͏ ͏ ͏ ͏ ͏ ͏ ͏ ͏ ͏ ͏ ͏ ͏ ͏ ͏ ͏ ͏ ͏ ͏ ͏ ͏ ͏ ͏ ͏ ͏ ͏ ͏ ͏ ͏ ͏ ͏ ͏ ͏ ͏ ͏ ͏ ͏ ͏ ͏ ͏ ͏ ͏ ͏ ͏ ͏ ͏ ͏
The Farmer Strikes Back
Thursday, November 21, 2024
(by studying law)
Why Leaders Believe the Product Operating Model Succeeds Where Agile Initiatives Failed
Thursday, November 21, 2024
The psychological, organizational, and strategic reasons behind this seeming contradiction ͏ ͏ ͏ ͏ ͏ ͏ ͏ ͏ ͏ ͏ ͏ ͏ ͏ ͏ ͏ ͏ ͏ ͏ ͏ ͏ ͏ ͏ ͏ ͏ ͏ ͏ ͏ ͏ ͏ ͏ ͏ ͏ ͏ ͏ ͏ ͏ ͏ ͏ ͏ ͏ ͏ ͏ ͏ ͏ ͏ ͏ ͏ ͏ ͏ ͏ ͏ ͏ ͏ ͏ ͏
December starts, prepare the 2025 marketing
Thursday, November 21, 2024
We're about a week from December 2024 😮 Did the time fly by for you? I would suggest NOW start planning for how to 2X your 2025. An easy way is to improve the effectiveness of everything in your