How to estimate disk space. @ Irrational Exuberance
Hi folks,
This is the weekly digest for my blog, Irrational Exuberance. Reach out with thoughts on Twitter at @lethain, or reply to this email.
Posts from this week:
-
How to estimate disk space.
-
Reading a Profit & Loss statement.
How to estimate disk space.
A few years ago while interviewing Nelson Elhage for Staff Engineer, he mentioned “estimation” as a particularly valuable skill. I hadn’t thought much about the idea of estimation as a skill, but his comment made me remember one of the best architecture interviews I’ve ever given, where the candidate was able to significantly narrow down the possible solutions by asking for a few details (as best I can remember: queries per second, expected number of rows, and necessary columns).
Historically, I’ve never been partcularly good at estimating disk space, so I decided to take a few hours working on that skill, which has turned into these notes which I hope will be helpful for others looking to improve their estimation as well. I’ll start by sharing a few useful rules for estimating disk space, then pull together a SQLite3 snippet to demonstrate validating an estimate.
Kilobytes (1000 bytes) and Kibibytes (1024 bytes)
The first point of confusion when estimating sizes is whether a kilobyte has 1024 bytes or 1000 bytes. The “correct answer” is that a “kilobyte” (kB) is 1000 bytes and a “kibibyte” (KB) is 1024 bytes. This distinction continues in other units, e.g. megabyte (MB, 1000^2) versus mebibyte (MiB, 1024^2), and gigabyte (GB, 1000^3) versus gibibyte (GiB, 1024^3).
The three key things here are: (1) understanding both the kilobyte and kibibyte units, (2) recognizing that someone you’re communicating with may not be familiar with the kibibyte family of units, and (3) adapting your approach to what they’re familiar with. In real life there are no points for being technically correct.
Sizing UTF-8, ints, and so on
While there are many data types worth being familiar with, the most common ones are:
-
UTF-8 characters are encoded in 1-4 bytes. Whether you should estimate space usage at 1, 2, 3 or 4 bytes depends on what you’re encoding. For example, if you’re only encoding ASCII values, then 1 byte is sufficient. What’s most important is being able to explain your rationale. For example, saying that you’re taking the most conservative case and using 4 bytes per character is reasonable.
Using UTF-8 sizes as a baseline, you can estimate the size of string, varchar, text or other similar fields. The precise overhead of those fields will absolutely vary a fair bit depending on the specific technology being used to store the data
-
integers depend on the maximum value you need to store, but a good baseline is 4 bytes. If you want to be more precise, then figure out the maximum size of the integer, and from there you can determine the number of kilobytes necessary to represent it by calculating
maxRepresentableIntegerInNBytes(N) = 2 ^ (N bytes * 8 bits) - 1For example, the largest number representable in 2 bytes is
2 ^ (2 bytes * 8 bits) -1 = 65535 -
floats are typically stored in 4 bytes
-
booleans are often represented as 1 byte integers (e.g. in MySQL)
-
enums are often represented as a 2 byte integers (e.g. in MySQL)
-
datetimes are often represents in 5 bytes (e.g. in MySQL)
Equipped with these rules, let’s do a practice run at estimating a database’s size. Imagine we have 10,000 people represented in our database. We track each person’s age and name. The average name is 25 characters long, and maximum age we want to support is 125. How much space should this take?
bytesPerName = 25 characters * 4 bytes = 100 bytes
bytesPerAge = 1 byte # because 2^(1 bytes * 8bits) = 255
bytesPerRow = 100 bytes + 1 byte
totalBytes = 101 bytes * 10,000 rows
totalKiloBytes = (101 * 10000) / 1000 # 1,100 kB
totalMegaBytes = (101 * 10000) / (1000 * 1000) # 1.1 MB
So, about 1.1 MB to store this. Alternatively this is 0.96 MiB, calculated via:
(101 * 10000) / (1024 * 1024) # 0.96 MiB
You can now estimate the generate size of datasets.
Indexes, replication, etc
There’s a gap between the theoretical cost of storing data and the actual cost of storing data in a database. You might be using a replica-based tool like MongoDB or Cassandra that stores three copies of each piece of data. You might be using a primary-secondary replication system that stores two copies of each piece of data. The storage impact is pretty easy to calculate here (respectively, 3x or 2x the base cost).
Indexes offer a classic tradeoff between additional storage and reduced query times, but exactly how much storage cost they’ll take up depends on the specifics of the index itself. As a simple approach to sizing indices, determine the size of the columns included in the index, multiply that by the number of rows indexed, and add that total to the underlying storage cost of the data itself. If you create an index including every field, then roughly estimate twice the total storage cost.
Depending on the particular database being usedd, there will be other features that take up space as well, and truly understanding their impact on the size will require understanding the particular database more deeply. The best way to accomplish that is to validate sizing directly with that database.
Validating with SQLite3
The good news is that it’s relatively easy to validate data sizing, which we’ll do now using Python and SQLite3. We’ll start by recreating the above estimation of 10,000 rows each containing a 25 character name and an age.
import uuid
import random
import sqlite3
def generate_users(path, rows):
db = sqlite3.connect(path)
cursor = db.cursor()
cursor.execute("drop table if exists users")
cursor.execute("create table users (name, age)")
for i in range(rows):
name = str(uuid.uuid4())[:25]
age = random.randint(0, 125)
cursor.execute("insert into users values (?, ?)", (name, age))
db.commit()
db.close()
if __name__ == "__main__":
generate_users("users.db", 10000)
Earlier we’d estimated this as 0.96 MiB, but running this script I see it’s only 344 KiB, just over a third of the expected space. Debugging our calculation a bit, we can see that we assumed 4 bytes per character, but the names we’re generating (truncated UUID4s) are all ascii characters, so would actually be 1 byte per character. Let’s reestimate the value based on that:
bytesPerName = 25 characters * 1 byte = 25 bytes
bytesPerAge = 1 byte
bytesPerRow = 26 bytes
totalKibiBytes = (26 * 10,000) / 1024 # 245 KIB
Alright, that’s fairly close assuming there’s some overhead, which there certainly is. For example, SQLite3 transparently creates a “rowid” column to use as the primary key, which is a 64 bit integer, which requires 4 bytes to represent. If we add those 4 bytes to our previous estimate of 26 bytes per row, then we get an estimated size of 293 KiB, which is comfortably close to our estimate.
Go forth and estimate sizes
Estimating the size of data is a relatively straightforward skill that’s both (a) easy to never learn and (b) quite useful once you’ve learned it. It can be useful when architecting systems, reasoning through debugging a complex distributed system problem, and certainly in discussing an architecture problem in an interview. Some of the useful distinctions that disk space estimation can help you answer:
- Can it fit in memory?
- Can it fit on one server with an SSD?
- Does this data need to be sharded across many servers? How many?
- Can this index fit on one server?
- If not, how will you partition the index properly?
- Etc, etc
Despite using them for some tiem, I continue to find it surprising how much this sort of technique can properly constrain your solution space.
Reading a Profit & Loss statement.
Some years ago, I was explaining to my manager that I was feeling a bit bored, and they told me to learn how to read a Profit & Loss (P&L) statement. At the time, that sounded suspiciously like, “Stop wasting my time,” but operating in an executive role has shifted my perspective a bit: this is actually a surprisingly useful thing to learn. The P&L statement is a map of a company’s operation and is an effective tool for pointing you towards the most pressing areas to dig in.
While there is a lot of depth to reading a P&L, this will walk you from zero to one, and will hopefully take a bit less than thirty minutes. I’ll start by reviewing the components of a P&L statement, describe the steps I use to review a P&L, show an example of applying those steps, and end with instructions for finding public companies P&L statements to practice on.
What’s in a P&L statement
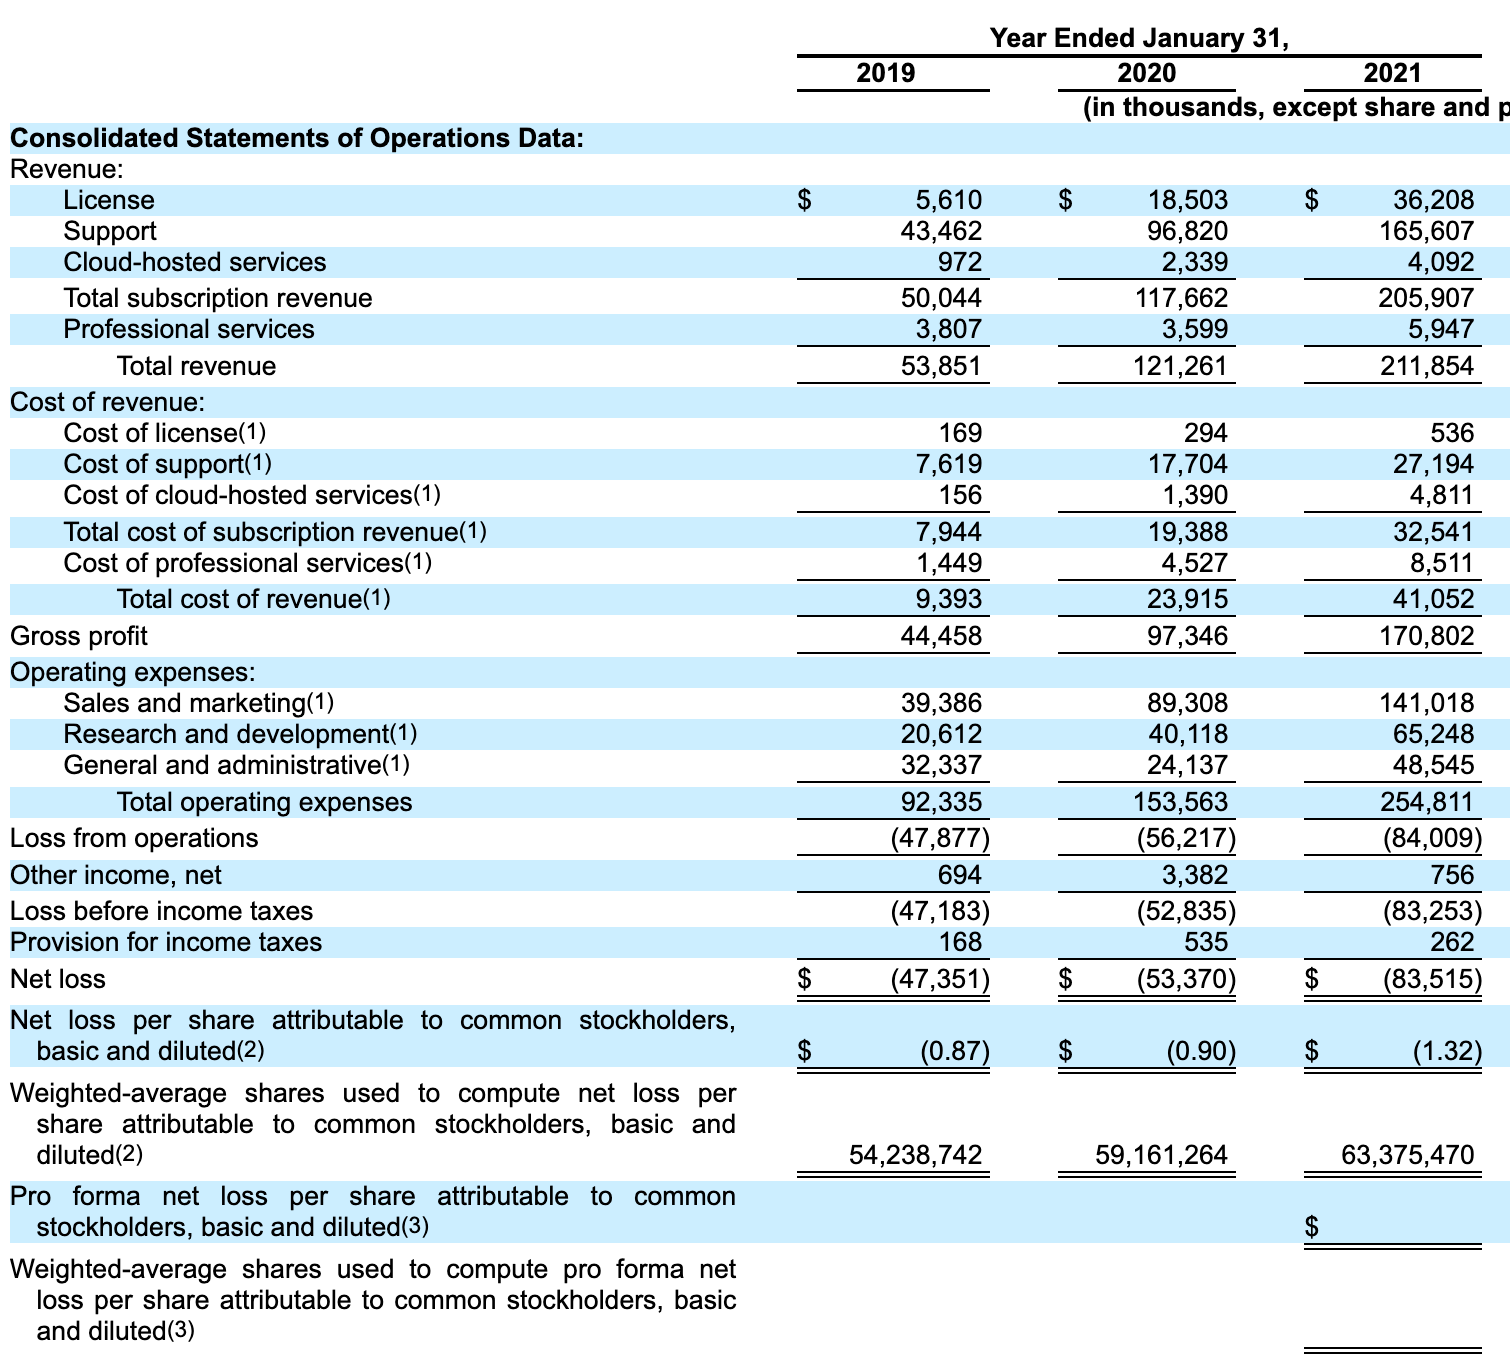
In order to review a P&L statement, we need a P&L statement to read, and I’ve selected Summary Consolidated Financial Data from page 18 of HashiCorp’s S-1 filing. It’ll be helpful to have that at hand to refer to throughout.
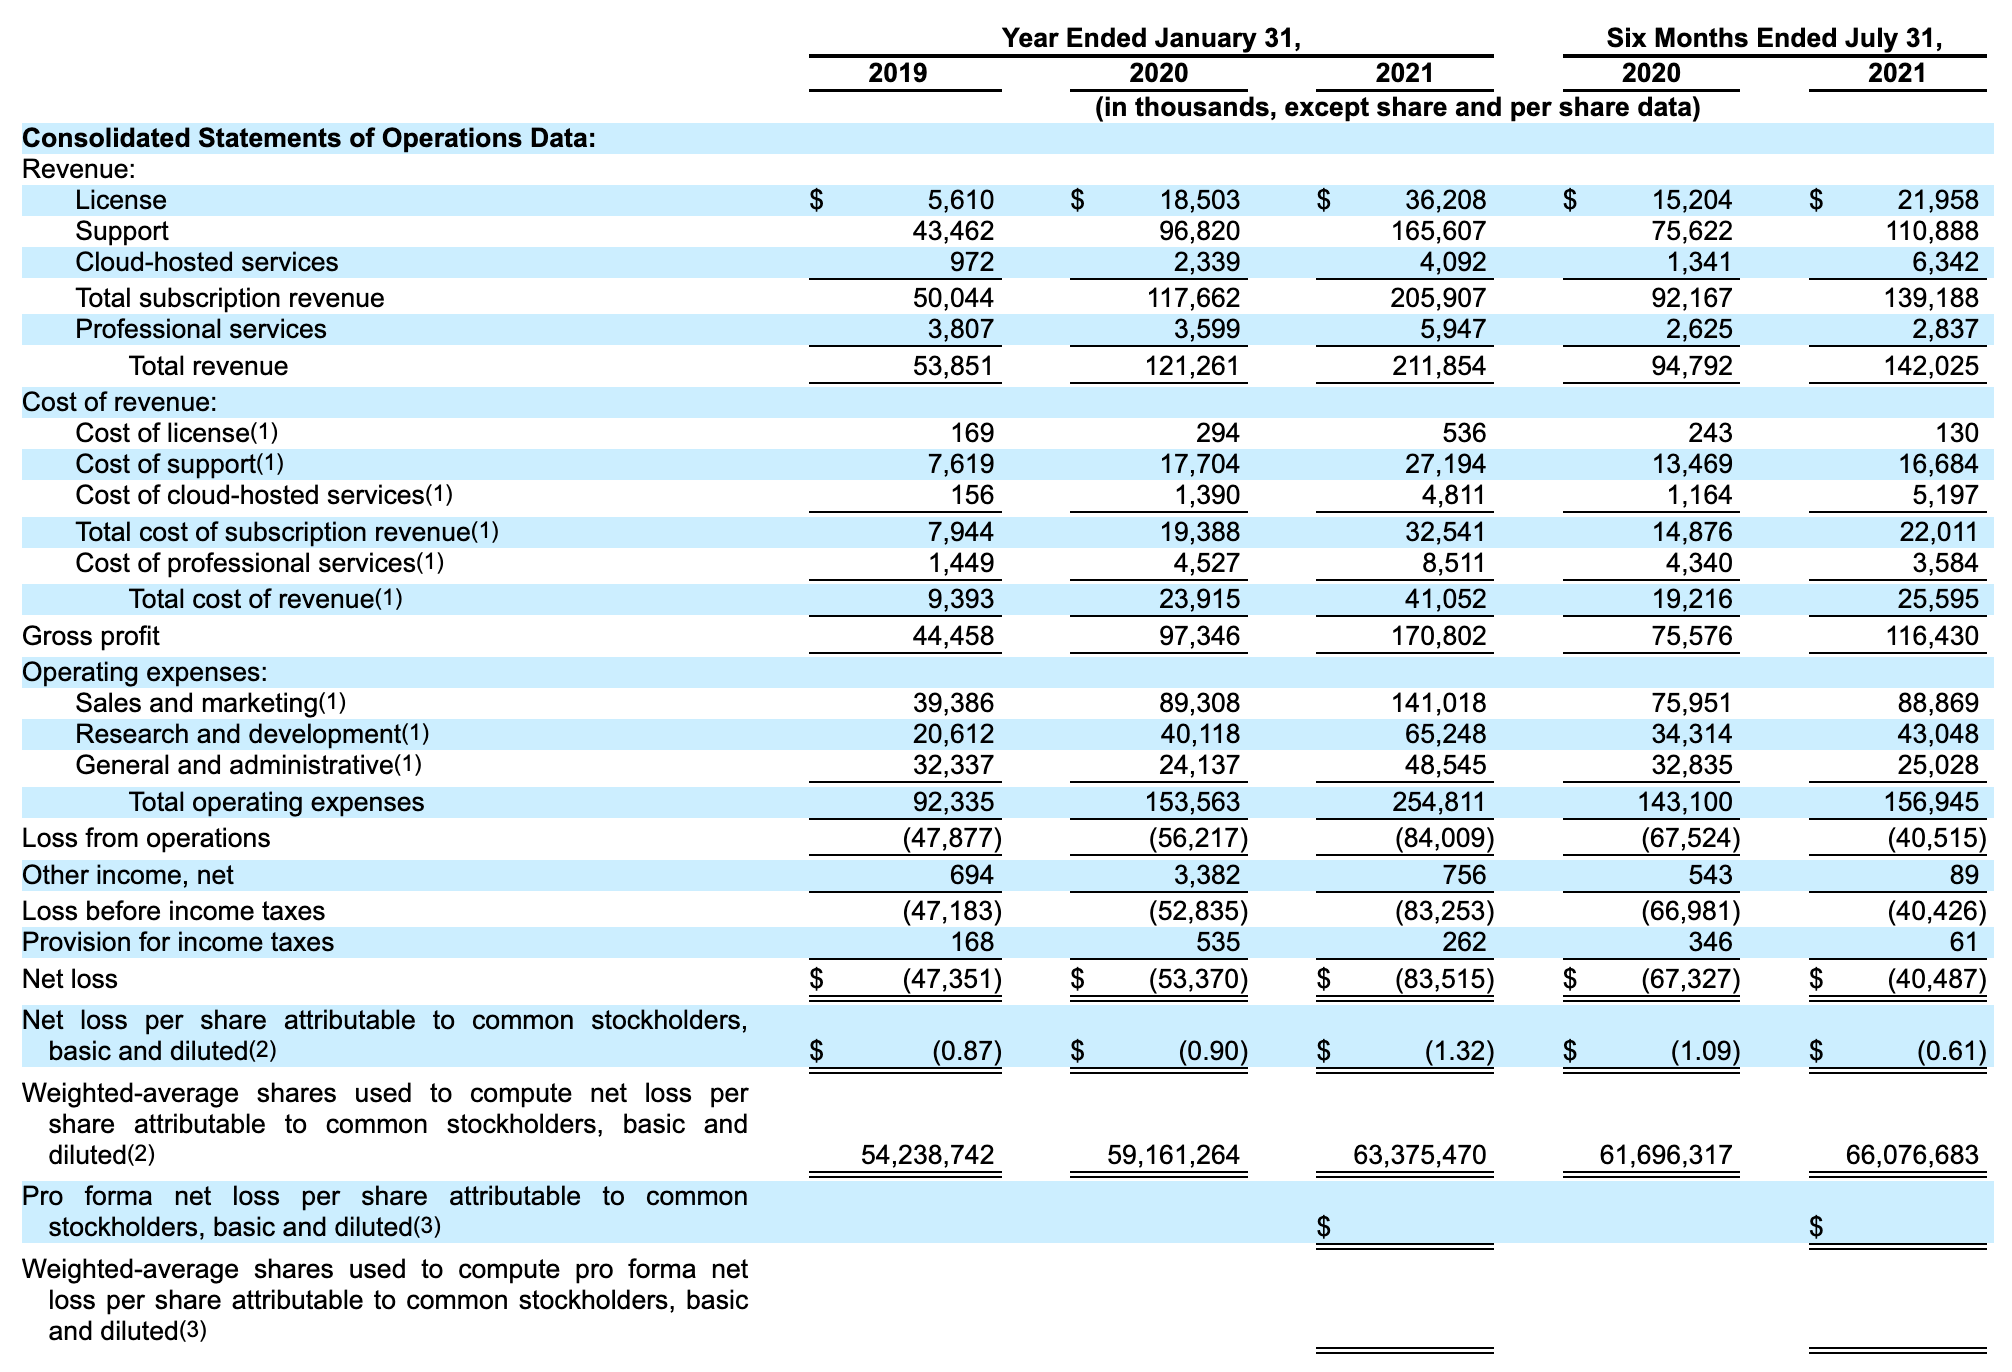
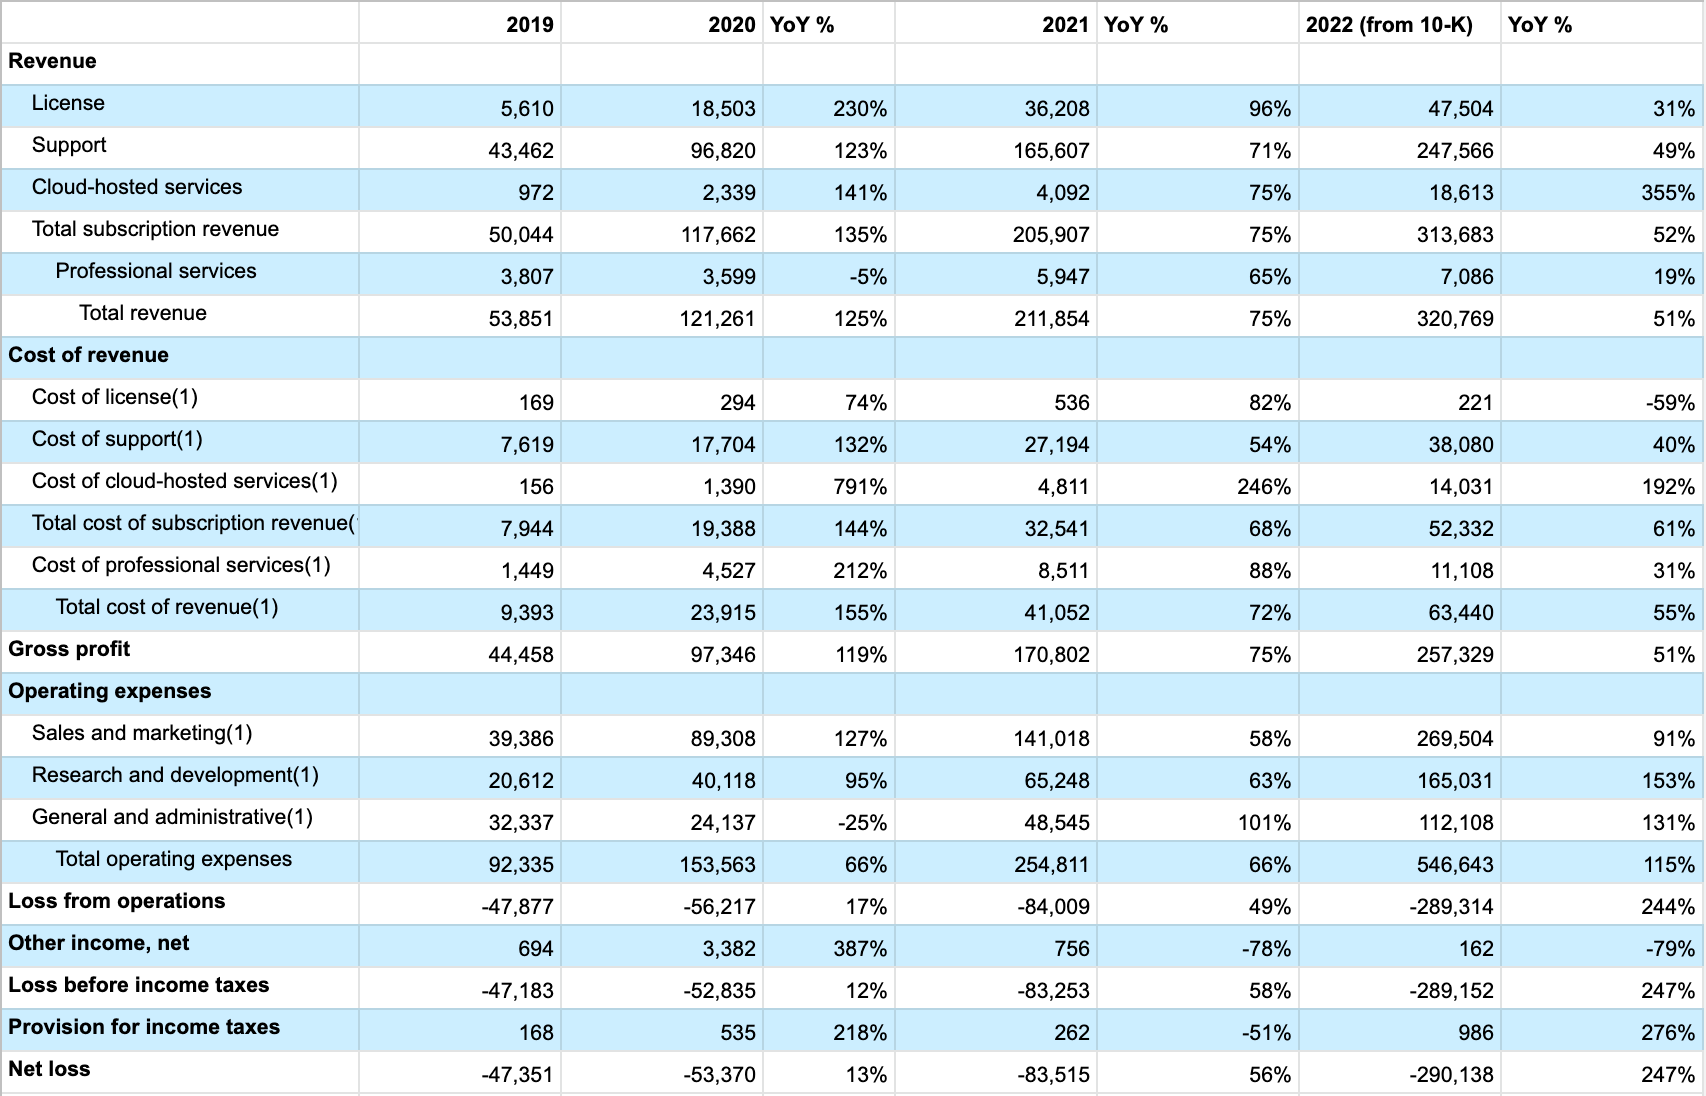
There’s a lot there! First let’s look at the top headers. The first three columns are showing revenue for 2019 through 2021. All numbers here are “in thousands”, meaning that $18,503 is actually $18,503,000 and so on. The last two columns are looking at six month windows. We’re trying to get a sense of the business overall, to let’s focus on the annual numbers.
It’s particularly important to understand where a table shifts from historical data to forecast data. In this case, the S-1 was filed on November 4, 2021, so the 2019 and 2020 numbers are historicals and the 2021 data is a forecast (albeit, a forecast with relatively little room for error as it was near the end of the year).
Next, lets take a look at the columns. The sections are:
- Revenue across a few different business lines (license, support, etc). This is how much money is booked by each business line. For example, “Support” brought in $43m of revenue in 2019
- Cost of revenue for each business line. This is the cost of producing the revenue. For example, “Cloud-hosted services” spent $156k in 2019 (to generate their $972k in revenue)
- Gross profit is “total revenue” minus “total cost of revenue”. This is how much profit the company would make if it had no operating expenses. For example, $170m in gross profit in 2021
- Operating expenses is how much money was spent operating the business. For example, $153m in 2020
- Loss from operations is “gross profit” plus “other income, net” minus “operating expenses”. For example, $83m in 2021
- Net loss is “gross profit” minus (“loss from operation” plus “provision for income taxes”). For example, $47m in 2019
There are a few more rows, but everything else you can ignore from the perspective of understanding the business.
Finally, it’s worth taking a moment to dig into GAAP vs Non-GAAP. The Financial Accounting Standards Board defines the accounting rules known as GAAP, Generally Accepted Accounting Principles, and most financials you’ll see will label themselves as either GAAP compliant or not, for example this segment of HashiCorp’s 10-K statement.
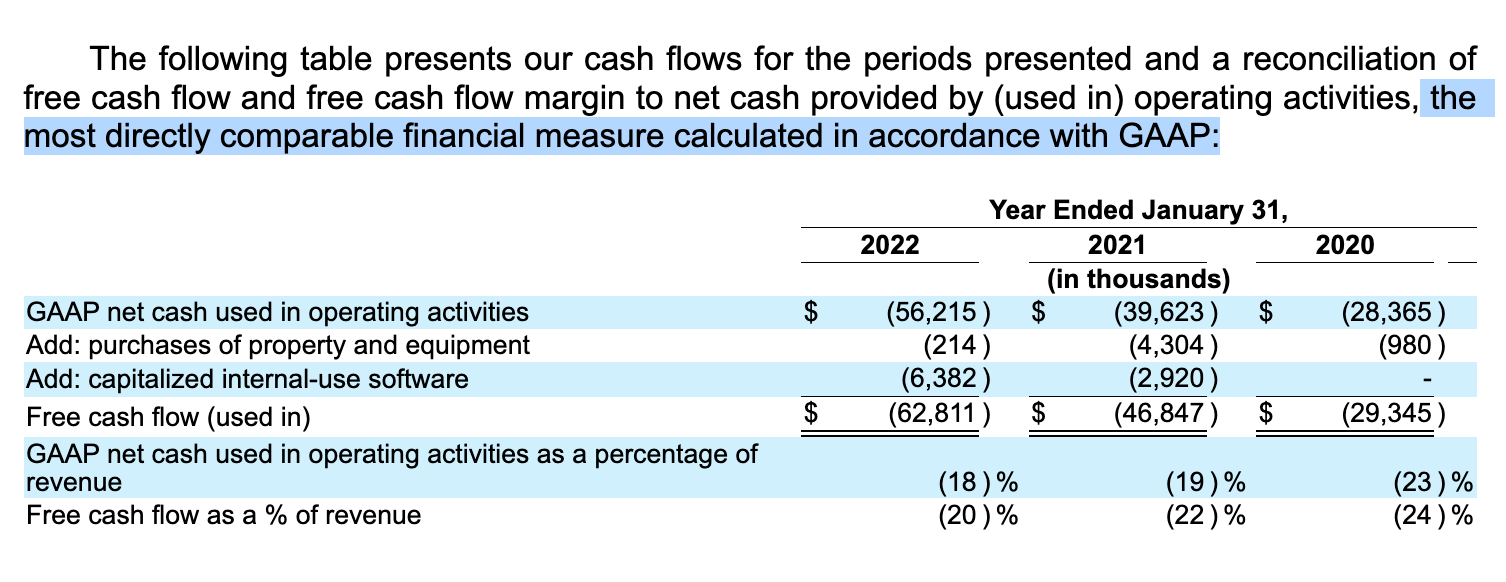
There is little consistency in how companies calculate their non-GAAP financials, which makes them tricky to reason about. Most frequently, companies exclude non-recurring or one-time expenses. Assuming you’re looking at your company’s internal P&L, the best bet is to ask someone on your Finance team to explicitly walk you through how any non-GAAP figures differ from the GAAP definition. Often non-GAAP gives a clearer understanding of a business’ operational state, but the goal of any non-GAAP measure is always crafting a narrative: make sure you understand the motivations behind that narrative!
Learning from a P&L
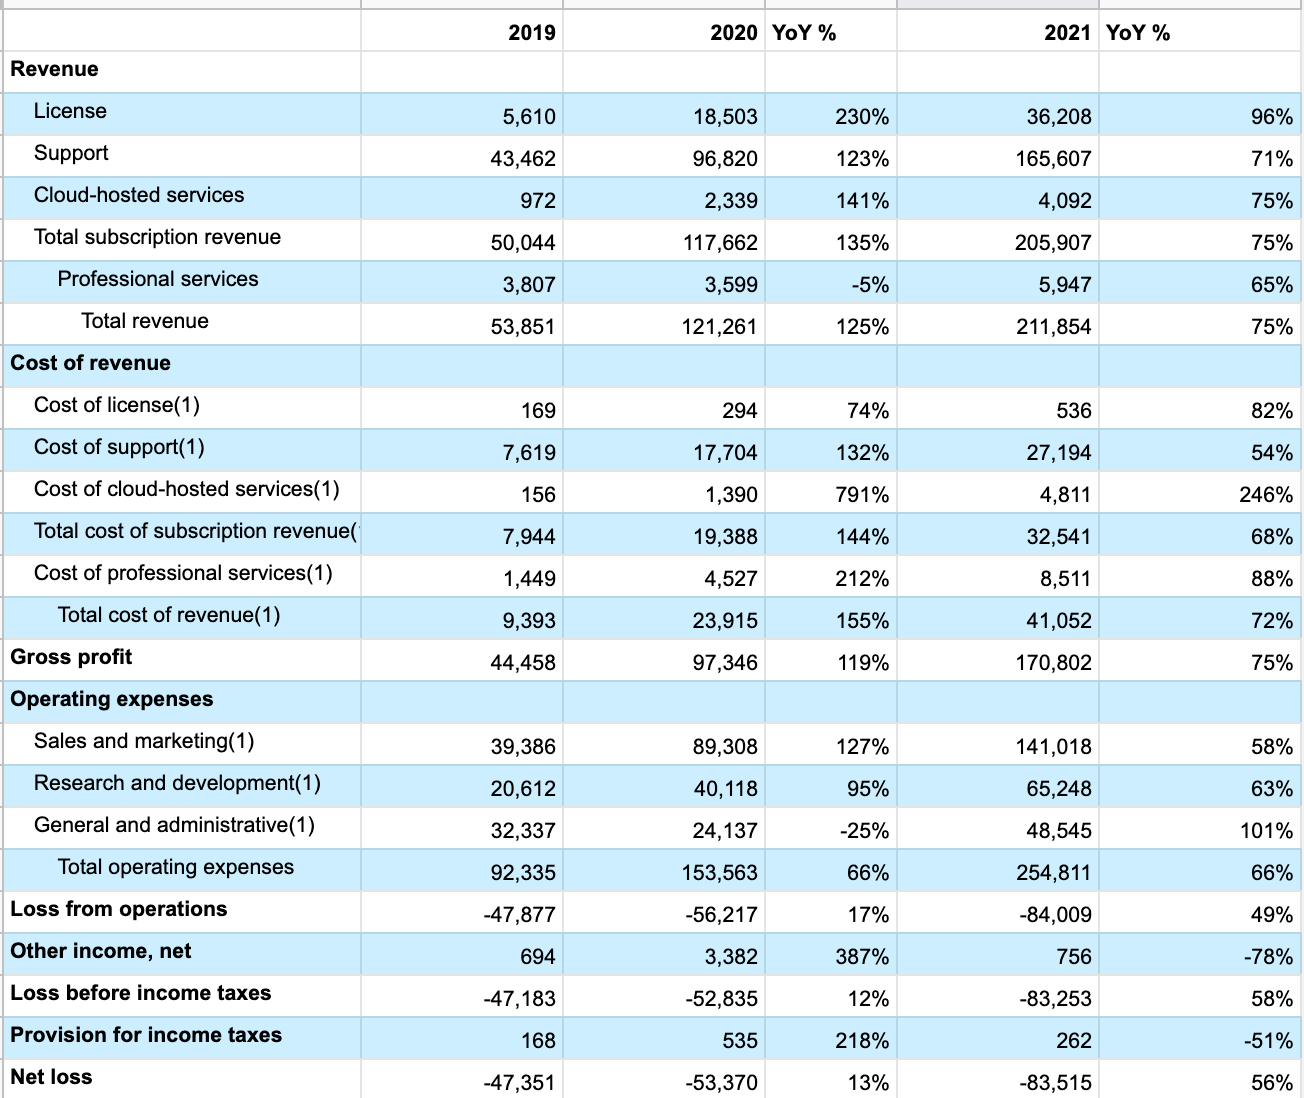
Now that we’ve covered the individual components of the P&L, let’s dig into actually analyzing it. The very first step to take is moving it into our own spreadsheet so we can do a bit of basic math, in this case using Google sheets. We’ll start with columns tracking year-over-year (YoY) growth.
Once you have a version of the table you can edit, the remaining steps I’d use to explore the statement are:
- understand relationship between revenue and cost of revenue, by business lines
- explore the delta between historical trend and forecast projections
- write down what you find surprising
- identify further actions to understand those surprising areas
The final step we’ll handle once we’ve collected our questions. Before that, we’ll go through the table row by row and apply the first three steps, starting with revenue:
- License revenue grew by 230% (‘19-‘20) and then 96% (‘20-‘21)
- Support revenue grew by 123% (‘19-‘20) and then 71% (‘20-‘21)
- Cloud services revenue grew by 141% (‘19-‘20) and then 75% (‘20-‘21)
- Total revenue grew by 125% (‘19-‘20) and then 75% (‘20-‘21)
- My sense of cloud services is that they’re going at an OK clip, but a bit slower than expected given their absolute size (4m in 2021) is relatively low. Purely from a financial analysis perspective, I’d wonder if maybe cloud services don’t yet have a strong product-market fit or perhaps are having some go-to-market challenges.
- In addition to cloud services, professional services is also small and growing slowly
- Altogether, these are all reasonable revenue growth rates, particularly the support revenue growth is strong given the absolute size of the business
Another question for each of these business lines is what percentage of revenue is coming from renewing customers and what percentage is coming from new business? The core of a good SaaS business is a healthy renewal rate: you need a much smaller sales team to drive revenue growth if the product does a good job of retaining existing revenue.
Next, looking at “cost of revenue.” What’s really interesting is places where cost growth is accelerating or decelerating relative to revenue growth. For example, license revenue grew by 96% in ‘20 to ‘21 and costs grew a bit slower at 82% in that same period. This means they’re achieving some economies in their growth. Conversely, it will definitely be interesting to dig into cloud services revenue and costs, where revenue only grew 75% from ‘20 to ‘21 while costs grew 246%. Not understanding the strategic role of cloud services, the P&L doesn’t tell a particularly optimistic story about its trajectory.
Sometimes the interesting questions come from shifts over time, for example it’s interesting that growth in support costs outpaced support revenue growth in ‘20, but not in ‘21. Understanding why support costs grew more slowly in ‘21 than in ‘20 will lead to a valuable insight into how that business truly operates.
Looking at total revenue growth versus total cost of revenue growth, there’s a slightly concerning trend that revenue is growing slower than costs in ‘20 (155% vs 125%) and just barely faster than costs in ‘21 (75% vs 72%). However, this is a situation where looking at percentage growth is a bit misleading. The absolute values tell a much healthier story, as is made clear in the gross profit line with strong positives across the line.
Next up is operating expenses. Sales and marketing (S&M) spend accelerated a fair bit in ‘20 and then decelerated in ‘21 on a relative basis. However, on absolute basis S&M costs grew by about $50m both years. That’s a large increase and worth digging into where that spend is going. It’s often helpful to look at the relative size across operating sections, and I personally find it a bit surprising that “General and administration” (G&A) is a larger operating cost than “Research and development” (R&D) and would love to understand that a bit better.
Finally, a quick look at net loss. This is not a profitable business, and the loss is growing. However, it’s grew less quickly than revenue growth in ‘21 and grew much slower than revenue growth in ‘20. Understanding what cused that swing (at least part of it was G&A costs doubling from ‘20 to ‘21) will make the path to profitability much clearer.
Digging into the questions
Alright, so let’s end by considering how we might dig into each of the surprising points (from the perspective of an internal executive). What I’ve found most effective is grouping the questions by team to follow up with, sending them your questions, and then scheduling time to discuss.
Questions to dig in with the finance team:
- What is revenue retention by business line? How much revenue is new reverses renewing? (This might be a sales team question, depends a bit on company and structure.)
- Why were G&A operating costs higher than R&D operating costs in ‘19? Why did G&A costs double from ‘20 to ‘21?
Questions to ask appropriate business owners:
- Why is cloud services growing relatively slowly? (talk to product and sales teams)
- Why are cloud services costs growing 3.5x faster than revenue? Do we expect that to no longer be true at some point in the future?
- Why did growth in support costs grow faster than support revenue growth in ‘21 but not in ‘20? What changed?
- What is the additional $50m S&M spend in both ‘20 and ‘21 going towards? How are we measuring efficiency of that spend?
Questions that should be answered by your management team’s strategy:
- What is path to profitability?
- What is our strategy around S&M operating costs versus R&D operating costs?
After having these discussions, you will have a vastly clearer understanding of your business’ reality. Before running an exercise like this, you may think that you understand your business, but you were relying on other folks’ interpretation for fuel that understanding. Now it’s your understanding driving your confidence.
This is an ongoing activity
After you dig through P&L, you might imagine that you’re done. That’s true in a discrete sense, but really your understanding is merely paused until the next iteration of the P&L becomes available. For example, we reviewed HashiCorp’s S-1 from late 2021, but five months later they published their 10-K on March 25th, 2022. On page 77, they have their 2022 forecast.
I won’t go into the full details, but if you review this spreadsheet combining their S-1 and 10-K results, you can tell they’re having a challenging here in 2022. HashiCorp is far from alone in that regard, almost everyone is having a rough year, but if they rise to this challenge, then they might come out of this adversity as a much more profitable company. This uncertainty is a bit part of why I don’t generally recommend folks try to make financially optimal moves during a downturn.
Finding S-1 and 10-Ks
A brief tangent on finding P&L statements for public companies. All the numbers shared in this piece are public record, and you can find them by going to Securities and Exchange Comission’s EDGAR search and typing in the companies name. Using HashiCorp for an example, I started typing in “hashi” after which search suggested HashiCorp’s ticker, “HCP”, and I clicked to HashiCorp, Inc’s page. From there click on “View filings” and you can see all the interesting filings, particularly the S-1 and 10-Ks.
Most companies will also have an investor relations (IR) website, like HashiCorp’s ir.hashicorp.com with links to their recent filings like this page hosting HashiCorp’s quarterly results. Generally, it’s easier to use EDGAR, but an IR website will often espouse the company’s preferred narrative through their earnings calls and press releases. Even if you do want to understand the company’s preferred narrative, I’d recommend reading their P&L without any narrative first to avoid unduly steering your attention in their preferred direction.
As a closing thought, P&Ls at early stage companies are often wrong, and they can be wrong in a lot of different ways. Costs can be miscategorized, non-recurring revenue can be booked as recurring revenue, etc. However, even when a P&L is wrong, it’s almost always wrong in an interesting way that will teach you about the underlying business and team running it. If you really want to understand a business starting from scratch, there are few better starting places than their latest P&L statement.
That's all for now! Hope to hear your thoughts on Twitter at @lethain!
|

Older messages
Downturn career decisions. @ Irrational Exuberance
Wednesday, July 6, 2022
Hi folks, This is the weekly digest for my blog, Irrational Exuberance. Reach out with thoughts on Twitter at @lethain, or reply to this email. Posts from this week: - Downturn career decisions.
STAR method for interview questions. @ Irrational Exuberance
Wednesday, June 22, 2022
Hi folks, This is the weekly digest for my blog, Irrational Exuberance. Reach out with thoughts on Twitter at @lethain, or reply to this email. Posts from this week: - STAR method for interview
Career checkup template. @ Irrational Exuberance
Wednesday, June 8, 2022
Hi folks, This is the weekly digest for my blog, Irrational Exuberance. Reach out with thoughts on Twitter at @lethain, or reply to this email. Posts from this week: - Career checkup template. Career
Plagarism, idea theft, and writing online. @ Irrational Exuberance
Wednesday, May 25, 2022
Hi folks, This is the weekly digest for my blog, Irrational Exuberance. Reach out with thoughts on Twitter at @lethain, or reply to this email. Posts from this week: - Plagarism, idea theft, and
Moving the finish line. @ Irrational Exuberance
Wednesday, May 18, 2022
Hi folks, This is the weekly digest for my blog, Irrational Exuberance. Reach out with thoughts on Twitter at @lethain, or reply to this email. Posts from this week: - Moving the finish line. Moving
You Might Also Like
The stuff that matters
Sunday, March 2, 2025
Plus, how to build a content library, get clients from social media, and go viral on Substack. ͏ ͏ ͏ ͏ ͏ ͏ ͏ ͏ ͏ ͏ ͏ ͏ ͏ ͏ ͏ ͏ ͏ ͏ ͏ ͏ ͏ ͏ ͏ ͏ ͏ ͏ ͏ ͏ ͏ ͏ ͏ ͏ ͏ ͏ ͏ ͏ ͏ ͏ ͏ ͏ ͏ ͏ ͏ ͏ ͏ ͏ ͏ ͏ ͏ ͏ ͏ ͏ ͏
Food for Agile Thought #482: No Place to Hide from AI, Cagan’s Vision For Product Teams, Distrust Breeds Distrust
Sunday, March 2, 2025
Also: Product Off-Roadmap; AI for PMs; Why Rewrites Fail; GPT 4.5 ͏ ͏ ͏ ͏ ͏ ͏ ͏ ͏ ͏ ͏ ͏ ͏ ͏ ͏ ͏ ͏ ͏ ͏ ͏ ͏ ͏ ͏ ͏ ͏ ͏ ͏ ͏ ͏ ͏ ͏ ͏ ͏ ͏ ͏ ͏ ͏ ͏ ͏ ͏ ͏ ͏ ͏ ͏ ͏ ͏ ͏ ͏ ͏ ͏ ͏ ͏ ͏ ͏ ͏ ͏ ͏ ͏ ͏ ͏ ͏ ͏ ͏ ͏ ͏ ͏ ͏ ͏ ͏
Pinterest For Authors 📌 30 Days of Book Pins 📌 1 Each Day
Sunday, March 2, 2025
"ContentMo is at the top of my promotions list ... "I'm amazed in this day and age there are still people around who treat you so kindly and go the extra mile when you need assistance. If
Is it bad to have too many options?
Saturday, March 1, 2025
Meet the Paradox of Choice ͏ ͏ ͏ ͏ ͏ ͏ ͏ ͏ ͏ ͏ ͏ ͏ ͏ ͏ ͏ ͏ ͏ ͏ ͏ ͏ ͏ ͏ ͏ ͏ ͏ ͏ ͏ ͏ ͏ ͏ ͏ ͏ ͏ ͏ ͏ ͏ ͏ ͏ ͏ ͏ ͏ ͏ ͏ ͏ ͏ ͏ ͏ ͏ ͏ ͏ ͏ ͏ ͏ ͏ ͏ ͏ ͏ ͏ ͏ ͏ ͏ ͏ ͏ ͏ ͏ ͏ ͏ ͏ ͏ ͏ ͏ ͏ ͏ ͏ ͏ ͏ ͏ ͏ ͏ ͏ ͏ ͏ ͏ ͏ ͏ ͏ ͏
[Electric Speed] Am I making a mistake?
Saturday, March 1, 2025
Plus: easy meeting scheduling | LA & Yosemite travel tips ͏ ͏ ͏ ͏ ͏ ͏ ͏ ͏ ͏ ͏ ͏ ͏ ͏ ͏ ͏ ͏ ͏ ͏ ͏ ͏ ͏ ͏ ͏ ͏ ͏ ͏ ͏ ͏ ͏ ͏ ͏ ͏ ͏ ͏ ͏ ͏ ͏ ͏ ͏ ͏ ͏ ͏ ͏ ͏ ͏ ͏ ͏ ͏ ͏ ͏ ͏ ͏ ͏ ͏ ͏ ͏ ͏ ͏ ͏ ͏ ͏ ͏ ͏ ͏ ͏ ͏ ͏ ͏ ͏ ͏
Community Seats for March 2025 to May 2025
Saturday, March 1, 2025
50 % off the Regular Price — Thank you for Being a Subscriber! ͏ ͏ ͏ ͏ ͏ ͏ ͏ ͏ ͏ ͏ ͏ ͏ ͏ ͏ ͏ ͏ ͏ ͏ ͏ ͏ ͏ ͏ ͏ ͏ ͏ ͏ ͏ ͏ ͏ ͏ ͏ ͏ ͏ ͏ ͏ ͏ ͏ ͏ ͏ ͏ ͏ ͏ ͏ ͏ ͏ ͏ ͏ ͏ ͏ ͏ ͏ ͏ ͏ ͏ ͏ ͏ ͏ ͏ ͏ ͏ ͏ ͏ ͏ ͏ ͏ ͏ ͏ ͏ ͏
• 30-Day Book Promo Package • Insta • FB Groups • Email Newsletter • Pins
Saturday, March 1, 2025
Newsletter & social media ads for books. Enable Images to See This "ContentMo is at the top of my promotions list because I always see a spike in sales when I run one of their promotions. The
New Course Live: Experimentation-Led GTM
Friday, February 28, 2025
A Go-to-Market Framework That Never Fails ͏ ͏ ͏ ͏ ͏ ͏ ͏ ͏ ͏ ͏ ͏ ͏ ͏ ͏ ͏ ͏ ͏ ͏ ͏ ͏ ͏ ͏ ͏ ͏ ͏ ͏ ͏ ͏ ͏ ͏ ͏ ͏ ͏ ͏ ͏ ͏ ͏ ͏ ͏ ͏ ͏ ͏ ͏ ͏ ͏ ͏ ͏ ͏ ͏ ͏ ͏ ͏ ͏ ͏ ͏ ͏ ͏ ͏ ͏ ͏ ͏ ͏ ͏ ͏ ͏ ͏ ͏ ͏ ͏ ͏ ͏ ͏ ͏ ͏ ͏ ͏ ͏ ͏ ͏ ͏
The Phone Game I Shouldn't Promote Because You'll Get Addicted
Friday, February 28, 2025
Help my spread my love of sharing by... uh, also sharing.
Chapter 3: Dynamic Societies
Friday, February 28, 2025
The third chapter from the documentary I'm creating is now live. ͏ ͏ ͏ ͏ ͏ ͏ ͏ ͏ ͏ ͏ ͏ ͏ ͏ ͏ ͏ ͏ ͏ ͏ ͏ ͏ ͏ ͏ ͏ ͏ ͏ ͏ ͏ ͏ ͏ ͏ ͏ ͏ ͏ ͏ ͏ ͏ ͏ ͏ ͏ ͏ ͏ ͏ ͏ ͏ ͏ ͏ ͏ ͏ ͏ ͏ ͏ ͏ ͏ ͏ ͏ ͏ ͏ ͏ ͏ ͏ ͏ ͏ ͏ ͏ ͏ ͏