📝 Guest post: Your Fitbit for data and model health*
Was this email forwarded to you? Sign up here In this article, our partner WhyLabs describes the importance of monitoring data health and how they are helping organizations track vitals along ML and data pipelines to proactively detect data quality, data drift, and model performance issues. And much like a Fitbit, the WhyLabs Observatory is easy to set up and even easier to use. You can dive directly into WhyLabs monitoring by signing up for a free account, or read on to learn more. Keeping your data and ML stack in shapeTop-performing athletes and weekend warriors alike track their body’s vital signs to keep themselves in tip-top shape. They use devices like Fitbits and Oura Rings to monitor their bodily health because they know how important it is to their craft. Top-performing ML engineers and data engineers do something similar: they monitor the health of their data pipelines and ML models to ensure their performance. WhyLabs is like a Fitbit for your data and model health. Install it throughout your data and ML stack to get real-time insights about changes to your data and model behavior. Otherwise, you risk model failure or misinformed business decisions due to bad data. WhyLabs Observatory organizes your data and ML applications’ vitals and continuously monitors them for anomalies, identifying changes in key metrics like:
These changes can indicate that there’s something wrong with your system. When the Observatory automatically detects an issue, it can take a number of different actions, including:
After you’ve been notified about an anomaly, you can also log in and perform root cause analysis (RCA) to determine the cause and fix the issue in minutes or hours instead of days or weeks. Being proactive about the health of your data and models is necessary to maintain their quality and performance, so you can ensure that they are continuing to provide value to your users. With WhyLabs, monitoring your entire data system is as easy as putting a Fitbit around your wrist. Getting alerts on key vitalsMonitoring data and ML models is critical for anybody using data or deploying models. But what are the biggest hesitations preventing teams from getting started with monitoring? Unhelpful alerts and lengthy configuration times. To make sure customers can easily configure monitoring on the platform, WhyLabs’ recent product efforts focused on refining the Observatory’s monitoring configuration experience to minimize unhelpful alerts and speed up monitor configuration. The new monitoring system maximizes the helpfulness of alerts and minimizes alert fatigue, so users can focus on improving their models instead of worrying about them in production. The new version of the WhyLabs monitoring system allows users to:
Customizable monitoring for any use caseWhyLabs’ customers come from a myriad of industries, including logistics, healthcare, fintech, retail, etc. What unites them is their reliance on the Observatory to provide a flexible and efficient monitoring experience for their models and data. Customizable monitoring enables them to do this efficiently, because they can.
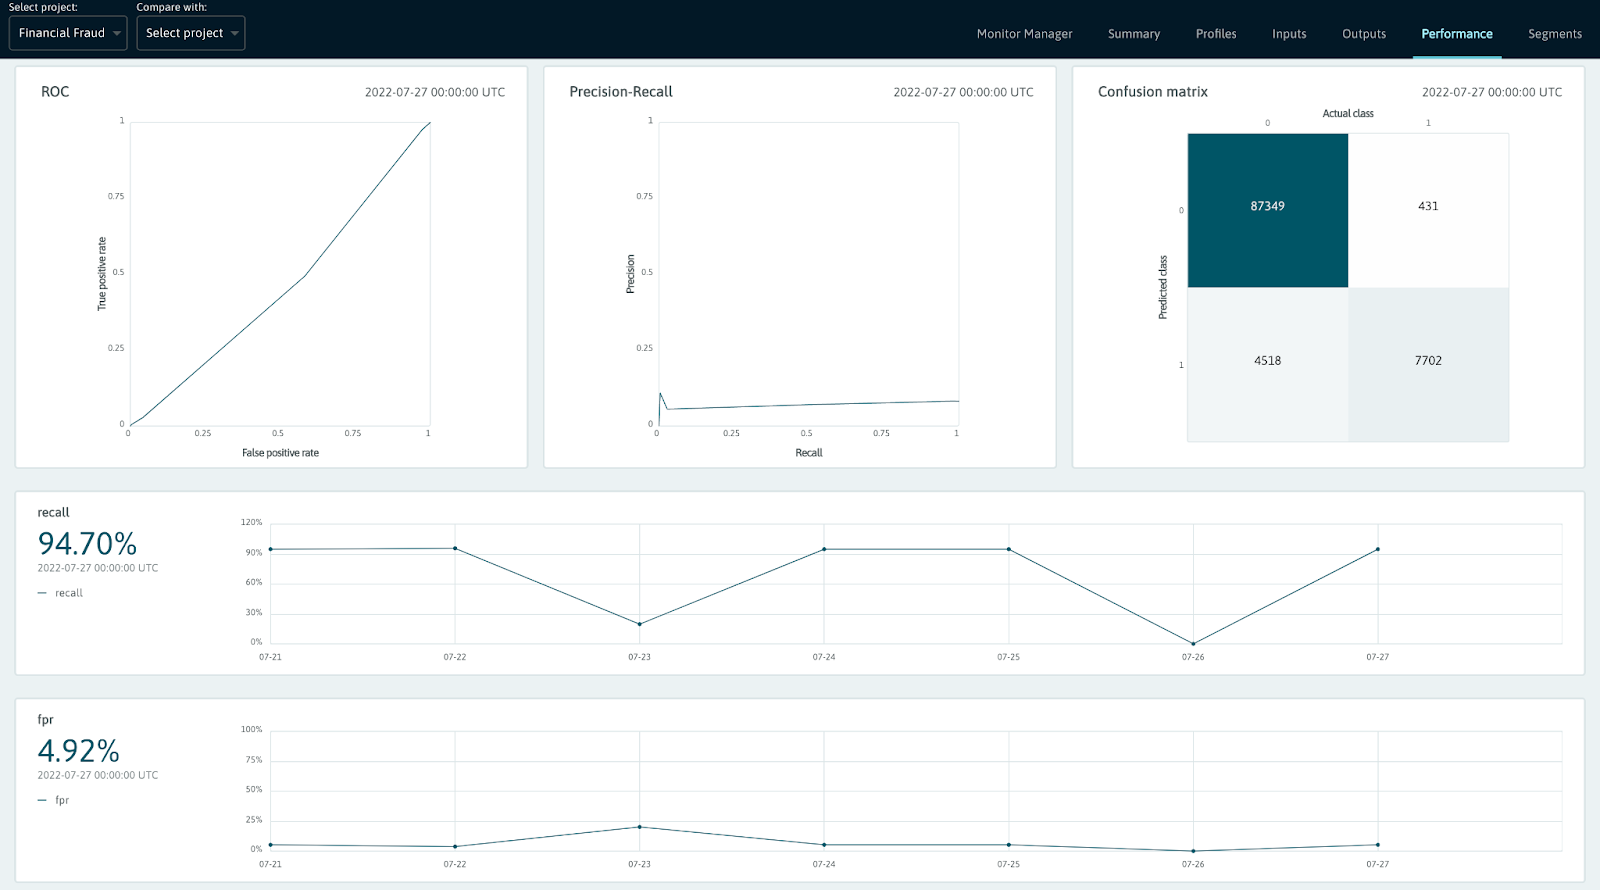
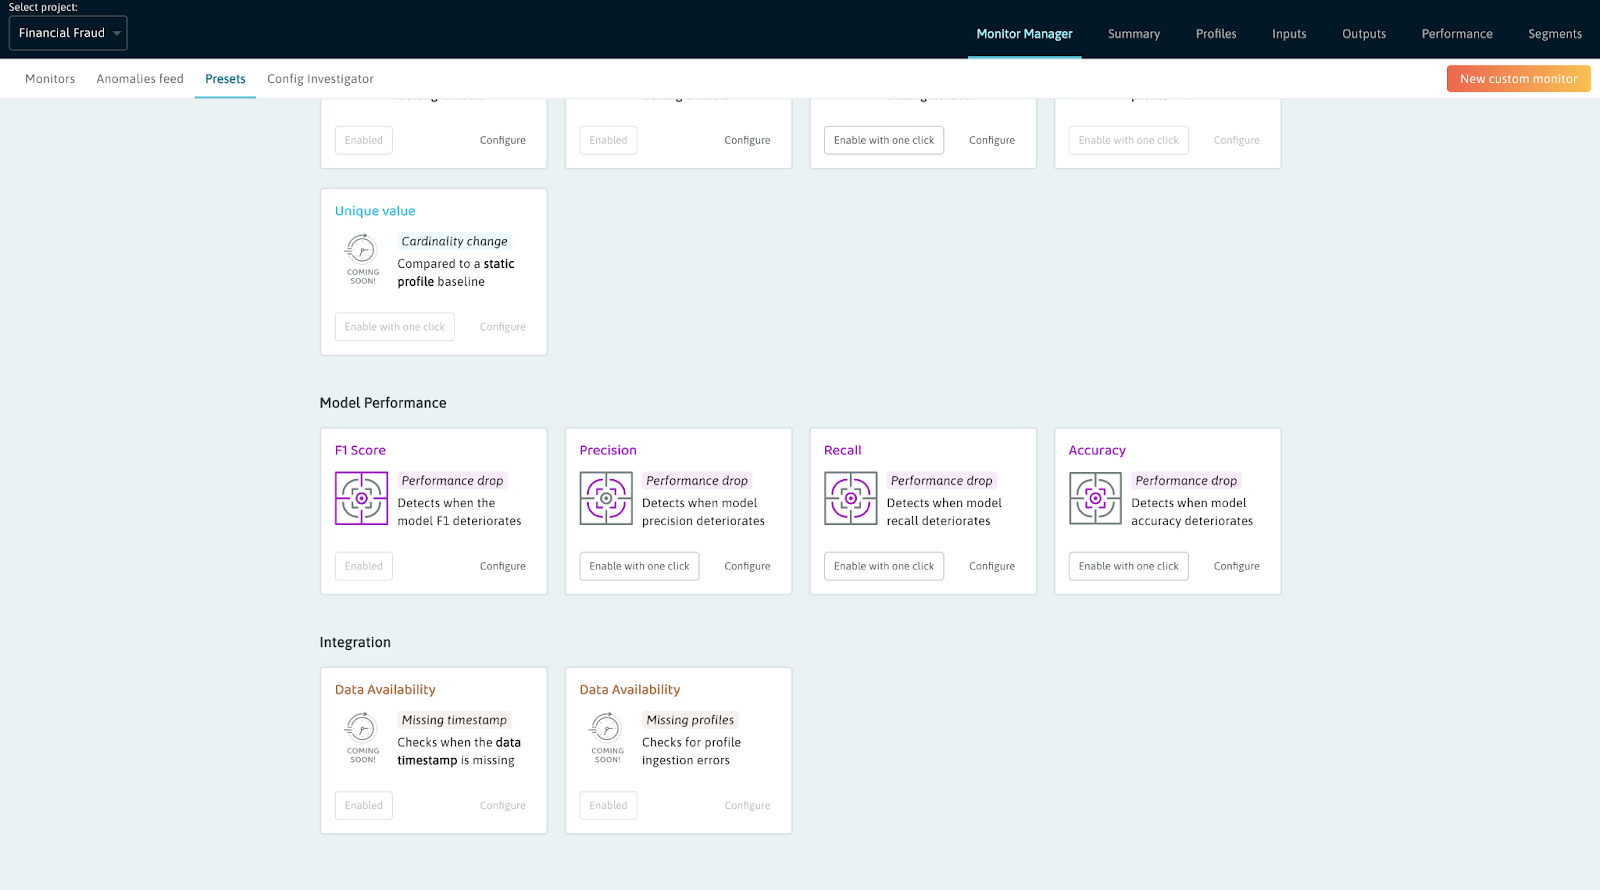
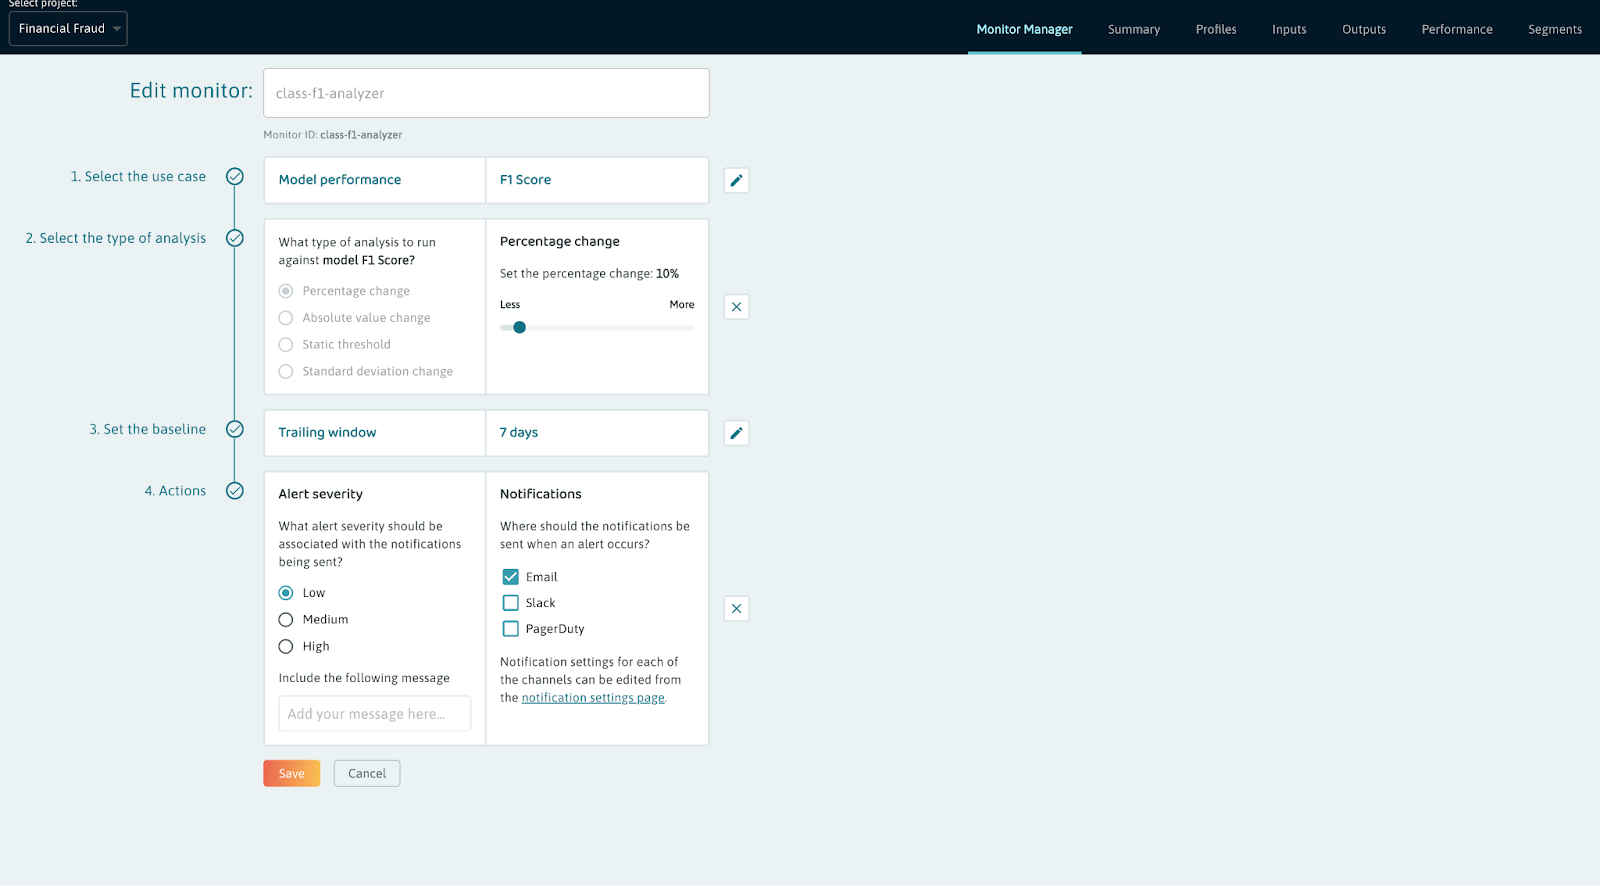
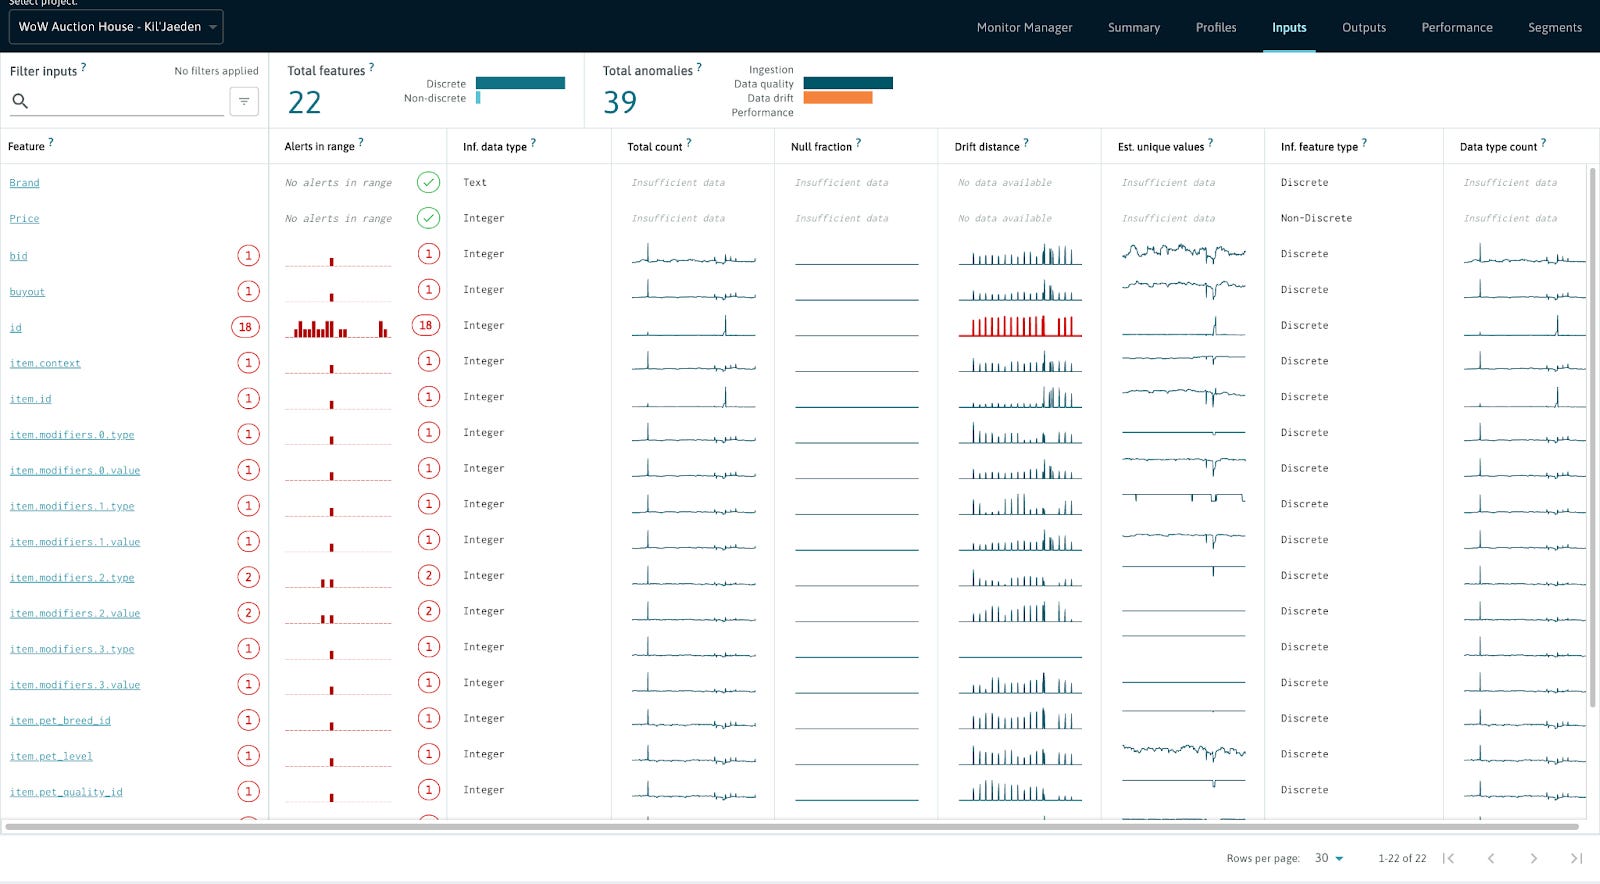
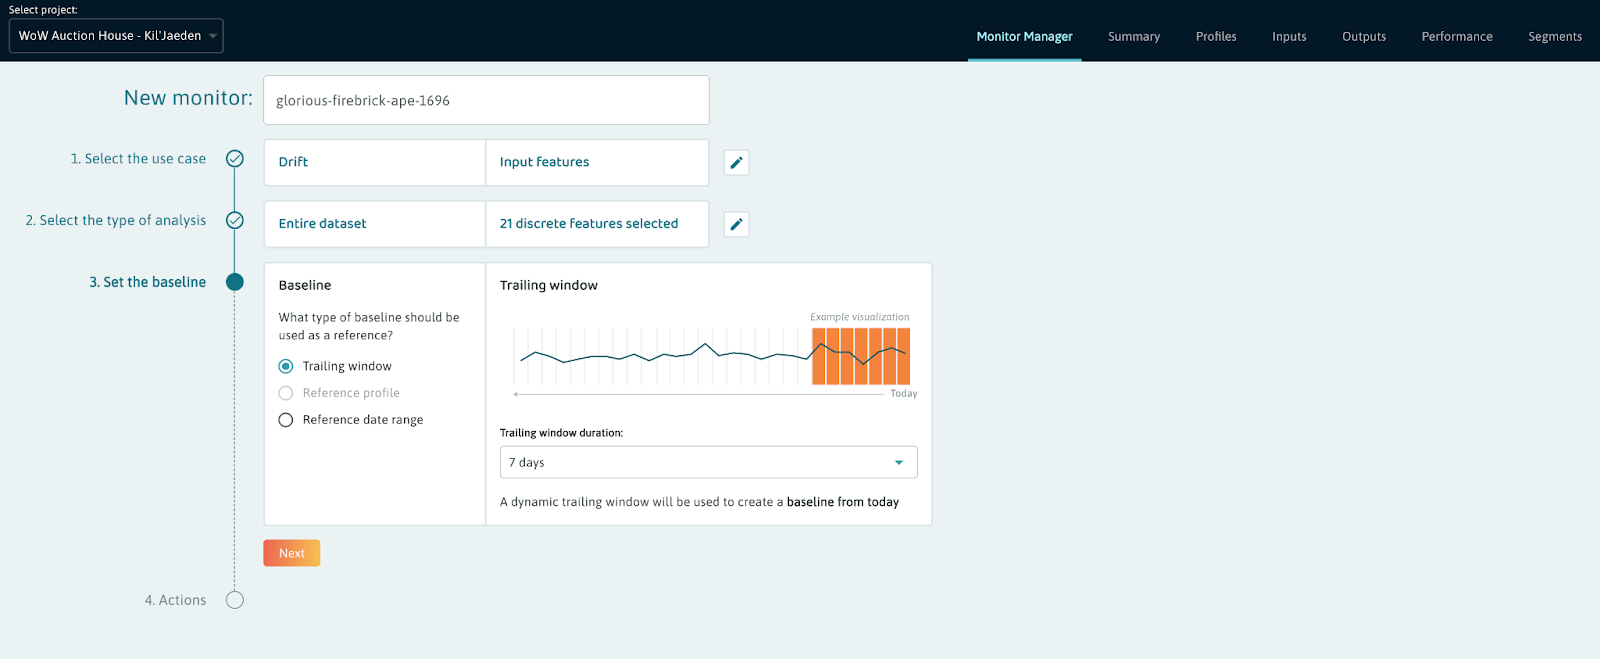
Start simple: one-click Preset monitorsWhile fully-customizable monitoring satisfies the most fine-grained use cases, not everything requires this level of tuning. When customers start using WhyLabs Observatory, they often prefer a simple way to switch on monitoring for their data and ML models. Our newest release makes this possible! The Presets monitoring experience makes it easy for you to configure the most essential monitors with a single click. API access is also available for turning on Preset monitors programmatically. These Presets intelligently configure granular monitors based on the data in the dataset or machine learning model. This approach allows monitoring to be configured for a model with thousands of features in a few clicks or an API call. Ready to dive in?If you are interested and ready to dive in, check out the Monitor Manager documentation or try it out for yourself by signing up for the platform. You can get started without a credit card and use our demo dataset if you don’t want to use your own. If you’d rather go through a few examples first, read on as we cover enabling a Preset monitor for a fraud classification model and customizing a monitor for a data stream. Model Monitoring: a fraud classification exampleTo see the monitoring experience in action, let’s walk through a classic example: a fraud classification model. The model classifies transactions as fraudulent or not. We will set up an observability Project that monitors the health of this model on the WhyLabs platform. In this scenario, customer support often notices an uptick in fraudulent transaction complaints, which is correlated with this model’s performance. I want to be proactive about retraining this model. I set up a model performance monitor using the Observatory UI. Let’s see how. After signing up for WhyLabs and following the 5 minute tutorial for onboarding my model, I navigate to the Presets tab within the Monitor Manager UI, which lets me enable monitors with one click. I switch on the F1 Score monitor to get alerted if my model has performance issues. This way, I can be proactive about fixing issues with my model instead of reacting only after customer service surfaces an issue. In this case, I am interested in getting a notification on Slack when my model has a performance issue, so I can resolve it immediately. Now, if my model’s performance worsens, I will get a Slack message right away, allowing me to dive in and start fixing the issue immediately. I can configure numerous other components of this Preset monitor, such as setting the appropriate percentage change and ensuring that I get only the most relevant alerts. Data Stream Monitoring: an auction house exampleAll of our customers rely on data to make business decisions, be it through a machine learning model, real-time analytics, customer-facing dashboards, or quarterly business reports. WhyLabs enables monitoring for any data in motion, no matter what decision-making it powers. In this particular example, we will dive into a streaming data use case. In this example, I’m the game developer and want to track the health of my application by looking at the data it produces. In particular, I want to track data drift for the transaction ID column because significant drifts in this field can indicate that there’s a bug in the application generating these IDs. Since I have a specific type of analysis and threshold in mind, I start by setting up a custom monitor. To begin tracking this data drift, I can click the orange “New custom monitor” button to create a new monitor. Within the custom monitor configuration, I have control over a number of different components of the monitor settings. Check out the WhyLabs monitor documentation to learn more about the options you have when configuring a monitor. After setting up my custom monitor, I’ll receive both an email and a Slack notification if the transaction ID column has drifted in its distribution and investigate it using the Observatory. For more details about monitoring data streams, check out our Kafka integration documentation. Try it for yourselfWhether you’re monitoring ML models, data, or both, WhyLabs Observatory is a powerful tool for ensuring that you can trust your data and machine learning systems. WhyLabs is here to ensure that you spend less time setting up your monitoring and more time refining your data and ML applications. Sign up to try WhyLabs Observatory for free and start monitoring your data and models today! *This post was written by the WhyLabs team. We thank WhyLabs for their ongoing support of TheSequence.You’re on the free list for TheSequence Scope and TheSequence Chat. For the full experience, become a paying subscriber to TheSequence Edge. Trusted by thousands of subscribers from the leading AI labs and universities.
|
Older messages
📄➡️🖼 Edge#219: A New Series About Text-to-Image Models
Tuesday, August 23, 2022
In this issue: we start the new series about text-to-image models; we discuss CLIP, a neural network that can learn image representations while being trained using natural language datasets; we explore
🍱 The Text-to-Image Synthesis Revolution
Monday, August 22, 2022
Weekly news digest curated by the industry insiders
📝 Guest post: "ML Data": The past, present and future*
Friday, August 19, 2022
In this article, co-founder and CTO of Galileo Atindriyo Sanyal gives a fascinating overview of 'ML data intelligence' evolution and shares a few insights on why the organizations that obsess
🗣🤖 Edge#218: Meta AI's BlenderBot 3, A 175B Parameter Model that can Chat About Every Topic and Organically Impr…
Thursday, August 18, 2022
The new release represents a major improvement compared to previous versions
🔂 Edge#217: ML Testing Series – Recap
Tuesday, August 16, 2022
Last week we finished our mini-series about ML testing, one of the most critical elements of the ML models' lifecycle. Here is a full recap for you to catch up with the topics we covered. As the
You Might Also Like
Import AI 399: 1,000 samples to make a reasoning model; DeepSeek proliferation; Apple's self-driving car simulator
Friday, February 14, 2025
What came before the golem? ͏ ͏ ͏ ͏ ͏ ͏ ͏ ͏ ͏ ͏ ͏ ͏ ͏ ͏ ͏ ͏ ͏ ͏ ͏ ͏ ͏ ͏ ͏ ͏ ͏ ͏ ͏ ͏ ͏ ͏ ͏ ͏ ͏ ͏ ͏ ͏ ͏ ͏ ͏ ͏ ͏ ͏ ͏ ͏ ͏ ͏ ͏ ͏ ͏ ͏ ͏ ͏ ͏ ͏ ͏ ͏ ͏ ͏ ͏ ͏ ͏ ͏ ͏ ͏ ͏ ͏ ͏ ͏ ͏ ͏ ͏ ͏ ͏ ͏ ͏ ͏ ͏ ͏ ͏ ͏ ͏ ͏ ͏ ͏ ͏ ͏ ͏
Defining Your Paranoia Level: Navigating Change Without the Overkill
Friday, February 14, 2025
We've all been there: trying to learn something new, only to find our old habits holding us back. We discussed today how our gut feelings about solving problems can sometimes be our own worst enemy
5 ways AI can help with taxes 🪄
Friday, February 14, 2025
Remotely control an iPhone; 💸 50+ early Presidents' Day deals -- ZDNET ZDNET Tech Today - US February 10, 2025 5 ways AI can help you with your taxes (and what not to use it for) 5 ways AI can help
Recurring Automations + Secret Updates
Friday, February 14, 2025
Smarter automations, better templates, and hidden updates to explore 👀 ͏ ͏ ͏ ͏ ͏ ͏ ͏ ͏ ͏ ͏ ͏ ͏ ͏ ͏ ͏ ͏ ͏ ͏ ͏ ͏ ͏ ͏ ͏ ͏ ͏ ͏ ͏ ͏ ͏ ͏ ͏ ͏ ͏ ͏ ͏ ͏ ͏ ͏ ͏ ͏ ͏ ͏ ͏ ͏ ͏ ͏ ͏ ͏ ͏ ͏ ͏ ͏ ͏ ͏ ͏ ͏ ͏ ͏ ͏ ͏ ͏ ͏ ͏ ͏ ͏
The First Provable AI-Proof Game: Introducing Butterfly Wings 4
Friday, February 14, 2025
Top Tech Content sent at Noon! Boost Your Article on HackerNoon for $159.99! Read this email in your browser How are you, @newsletterest1? undefined The Market Today #01 Instagram (Meta) 714.52 -0.32%
GCP Newsletter #437
Friday, February 14, 2025
Welcome to issue #437 February 10th, 2025 News BigQuery Cloud Marketplace Official Blog Partners BigQuery datasets now available on Google Cloud Marketplace - Google Cloud Marketplace now offers
Charted | The 1%'s Share of U.S. Wealth Over Time (1989-2024) 💰
Friday, February 14, 2025
Discover how the share of US wealth held by the top 1% has evolved from 1989 to 2024 in this infographic. View Online | Subscribe | Download Our App Download our app to see thousands of new charts from
The Great Social Media Diaspora & Tapestry is here
Friday, February 14, 2025
Apple introduces new app called 'Apple Invites', The Iconfactory launches Tapestry, beyond the traditional portfolio, and more in this week's issue of Creativerly. Creativerly The Great
Daily Coding Problem: Problem #1689 [Medium]
Friday, February 14, 2025
Daily Coding Problem Good morning! Here's your coding interview problem for today. This problem was asked by Google. Given a linked list, sort it in O(n log n) time and constant space. For example,
📧 Stop Conflating CQRS and MediatR
Friday, February 14, 2025
Stop Conflating CQRS and MediatR Read on: my website / Read time: 4 minutes The .NET Weekly is brought to you by: Step right up to the Generative AI Use Cases Repository! See how MongoDB powers your

