|
I've never liked the SaaS "magic number."
It always struck me as somewhat contrived — a simple metric with intuitive appeal, but one that is so overused and confused at this point that it harms analysis more than it helps.
My core beef with the metric is that it takes what is fundamentally a correlational relationship and confuses it with causality, to the chagrin of many strategic finance teams on the inside and investors attempting to model and forecast businesses from the outside.
While it'd be an overstep to say that sales and marketing doesn't cause revenue growth at all, I've realized most companies and investors are totally confused about the extent to which it does.
I want to set the story straight.
First, let's get definitions out of the way. "Magic number" is defined as follows:

Magic number is typically calculated on a quarterly basis, often with S&M shifted back one period, better matching and reflecting that software sales typically take anywhere from 3-6 months.
Magic number is just a ratio — it's New ARR divided by S&M expense. It tells us nothing about the degree to which that spending caused the New ARR. In fact, for reasons I will illuminate, the degree to which S&M spending actually causes new revenue is almost certainly less than is implied by this not-so-magical ratio. In other words, magic number overestimates the causal impact of S&M spending, rendering it useless for decision making.
Here's why:
- Omitted / confounding variables
- Reverse causality and simultaneity
- Observation vs. intervention
I'll walk through each in turn.
Omitted / confounding variables
Magic number is a faulty metric because it ignores important revenue growth factors and incorrectly attributes those growth contributions to "sales and marketing efficiency."
To illustrate this, I'll start with a very simple point. Refer back to the definition of magic number — New ARR divided by sales and marketing spend:
The first thing to note is that New ARR has two sources — S&M and "other stuff":

New ARR can either come from our investments in S&M or it can come from other sources. This could include organic inbound (which may or may not be "marketing" driven depending on the situation), R&D (we release a new feature or product that the market already wants, and it effectively sells itself), etc:

Rather than enumerate all the possible alternative sources of revenue, let's just crudely summarize them under "Other Stuff" and modify our equation to reflect this attribution:

If we break this fraction into two parts, the first would represent "true" magic number — the true causal impact of S&M spend — while the second would represent the degree to which the typical measure of magic number is inflated by misattribution of New ARR:

In other words, magic number omits important non-S&M contributors to revenue and in doing so falsely attributes the New ARR from these alternate sources to S&M. Thus, in a perverse way, we reward ourselves for S&M "efficiency" when in fact it is other factors that meaningfully drive revenue growth. For all we know, our sales and marketing expenditures could be woefully inefficient, but we fool ourselves into thinking otherwise.
Because these other sources of revenue nearly always contribute positively to ARR growth, the magic number inflation factor is almost always positive, meaning that the standard measure for magic number is typically an inflated estimate of the true causal influence of S&M spend. This has serious implications for our ability to model and forecast revenue growth based on assumed S&M inputs.
This also explains why magic number tends to decline when S&M grows rapidly and tends to increase when S&M spend is suddenly cut. It's partly because S&M has diminishing returns, i.e. "true magic number" tends to fluctuate with S&M spend itself. But the other reason is the inflation factor, which includes S&M in the denominator. This means that when S&M grows quickly (specifically, faster than "New ARR from Other Stuff"), the inflation factor decreases, so our measured magic number decreases. The reverse happens when S&M grows more slowly — magic number inflation increases.
In statistics parlance, magic number is biased estimate of the "true" magic number due to omitted or confounding variables:
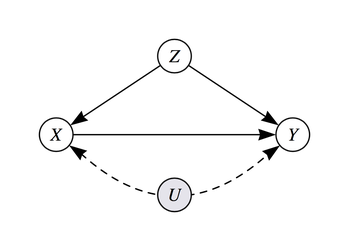
In the diagram above, Y is New ARR, X is S&M, Z is a set of observed variables that influence both S&M and New ARR, and U is a set of unobserved variables that also influence our P&L. Unobservables are, by definition, not observed and therefore difficult to account for, but at a minimum we should attempt to control for those observed variables that influence S&M and/or New ARR.
Magic number does neither, guaranteeing that it won't properly measure the impact of S&M on revenue. Magic number is therefore less a measure of sales efficiency and more a measure of its correlation with new revenue. Another name for this is spurious correlation. You've probably seen one of these funny charts before:
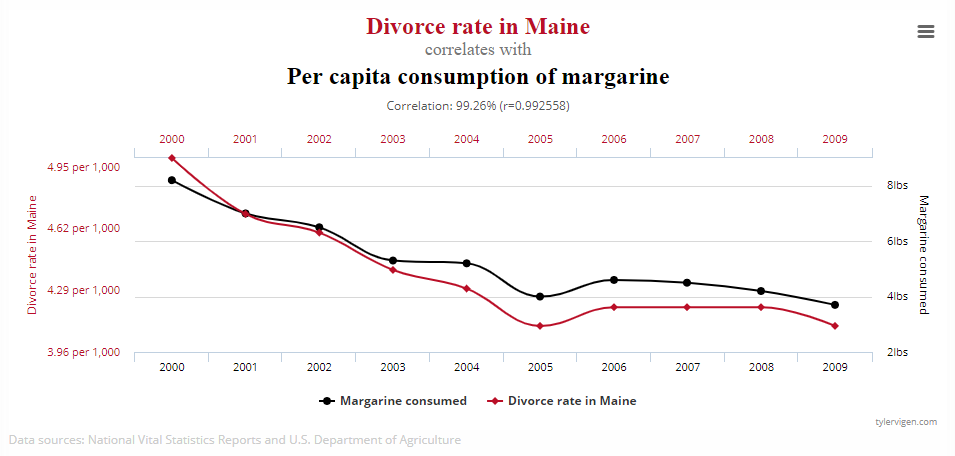
Two variables can be totally unrelated, yet be nearly perfectly correlated. In this case, the "magic number" between margarine consumption and Maine divorces is totally meaningless. Again, the point here isn't that S&M and New ARR aren't at all related; the point is that because they tend to move together and are plausibly related, we tend to think they are much more related than they in fact are.
Reverse causality and simultaneity
There's a tendency to think, "Well, S&M is in the denominator and revenue is in the numerator, so S&M must be driving revenue." That way of thinking also accords with the way sales and marketing is framed most of the time — they are the "revenue generating" part of the business, so investments in S&M must, to some extent, drive revenue.
But rarely asked is the reverse — to what degree does revenue cause S&M expense?
Now, that might at first seem absurd, but don't dismiss it so easily. Revenue almost certain does cause S&M. How? Well, in the most basic sense, aside from capital raised from the outside, the main source of funding for all expenses on the income statement is revenue. That's where the business earns the cash that it can then spend on various initiatives.
If you still don't believe me, think about this proof of concept. Does COGS (Cost of Goods Sold) cause revenue, or does revenue cause COGS? Clearly revenue causes COGS, by definition, since COGS is the cost of goods sold, so something has to be sold (and revenue has to be generated), in order for COGS expense to show up. So clearly, revenue can cause expenses to some degree.
What we choose to spend on S&M is dependent on the revenue we expect to earn. For example, if you know your S&M is highly effective at driving revenue growth, that is likely to encourage you to invest more in S&M. Conversely, if S&M is not very effective at driving revenue, you will likely spend less than you might otherwise. In that subtle way, revenue (or more accurately in this case, expected revenue) influences S&M spend.
You may not have ever considered this, but it shouldn't be too surprising. There's a reason you rarely see companies spending, say, 500% of revenue on S&M. Companies typically limit their S&M spend to some reasonable level relative to current revenue. Therefore, revenue in some way influences S&M spend. Economists would say that S&M is endogenously determined — it's not some number we pull out of thin air. Our expectations for how valuable it will be and how much revenue we have in the first place determine how much we invest in S&M. Further, our business plans and objectives ("hitting $XM in ARR by year end") influences our S&M spending decisions.
This phenomenon — where A causes B and B also causes A — is called simultaneity in statistics and econometrics. More colloquially, you might know this as reverse causation.
Reverse causation poses a serious problem to our attempts to forecast new revenue from sales and marketing expenditure. Because magic number estimates the relationship between S&M and revenue from observational data rather than some kind of controlled experiment, we don't know the degree to which one causes the other or the reverse. If a business has a magic number of 1, that could mean that $1 of S&M causes $1 of New ARR, or it could mean that businesses that expect to add $1 in New ARR choose to limit their S&M to roughly $1.
The answer is somewhere in the middle, and yet magic number assumes the former. Not good.
Observation vs. intervention
The third and final problem with magic number is that is confuses observation and intervention. This is very related to the notion of correlation vs. causation but goes further by personifying causation a bit.
Observation means watching something happen, making no attempts to influence the outcome or the relevant variables. As an analyst measuring the sales efficiency of a software business from the outside, magic number is an observational metric. You can't do anything to influence any of the inputs, you are merely reporting their values. Magic number is not a good measure of sales efficiency, but as long as you acknowledge this caveat, there's nothing inherently wrong with calculating its value, useless though it may be.
However, if you are an actor inside the business intending to intervene in some way, choosing how much to spend on S&M, the entire game changes. In this case, magic number is not only useless as a measure of sales efficiency, but it is in fact a logical fallacy to use it to forecast the revenue impact from assumed S&M spend.
The reasons behind this are somewhat subtle, but this analogy should make it quite clear.
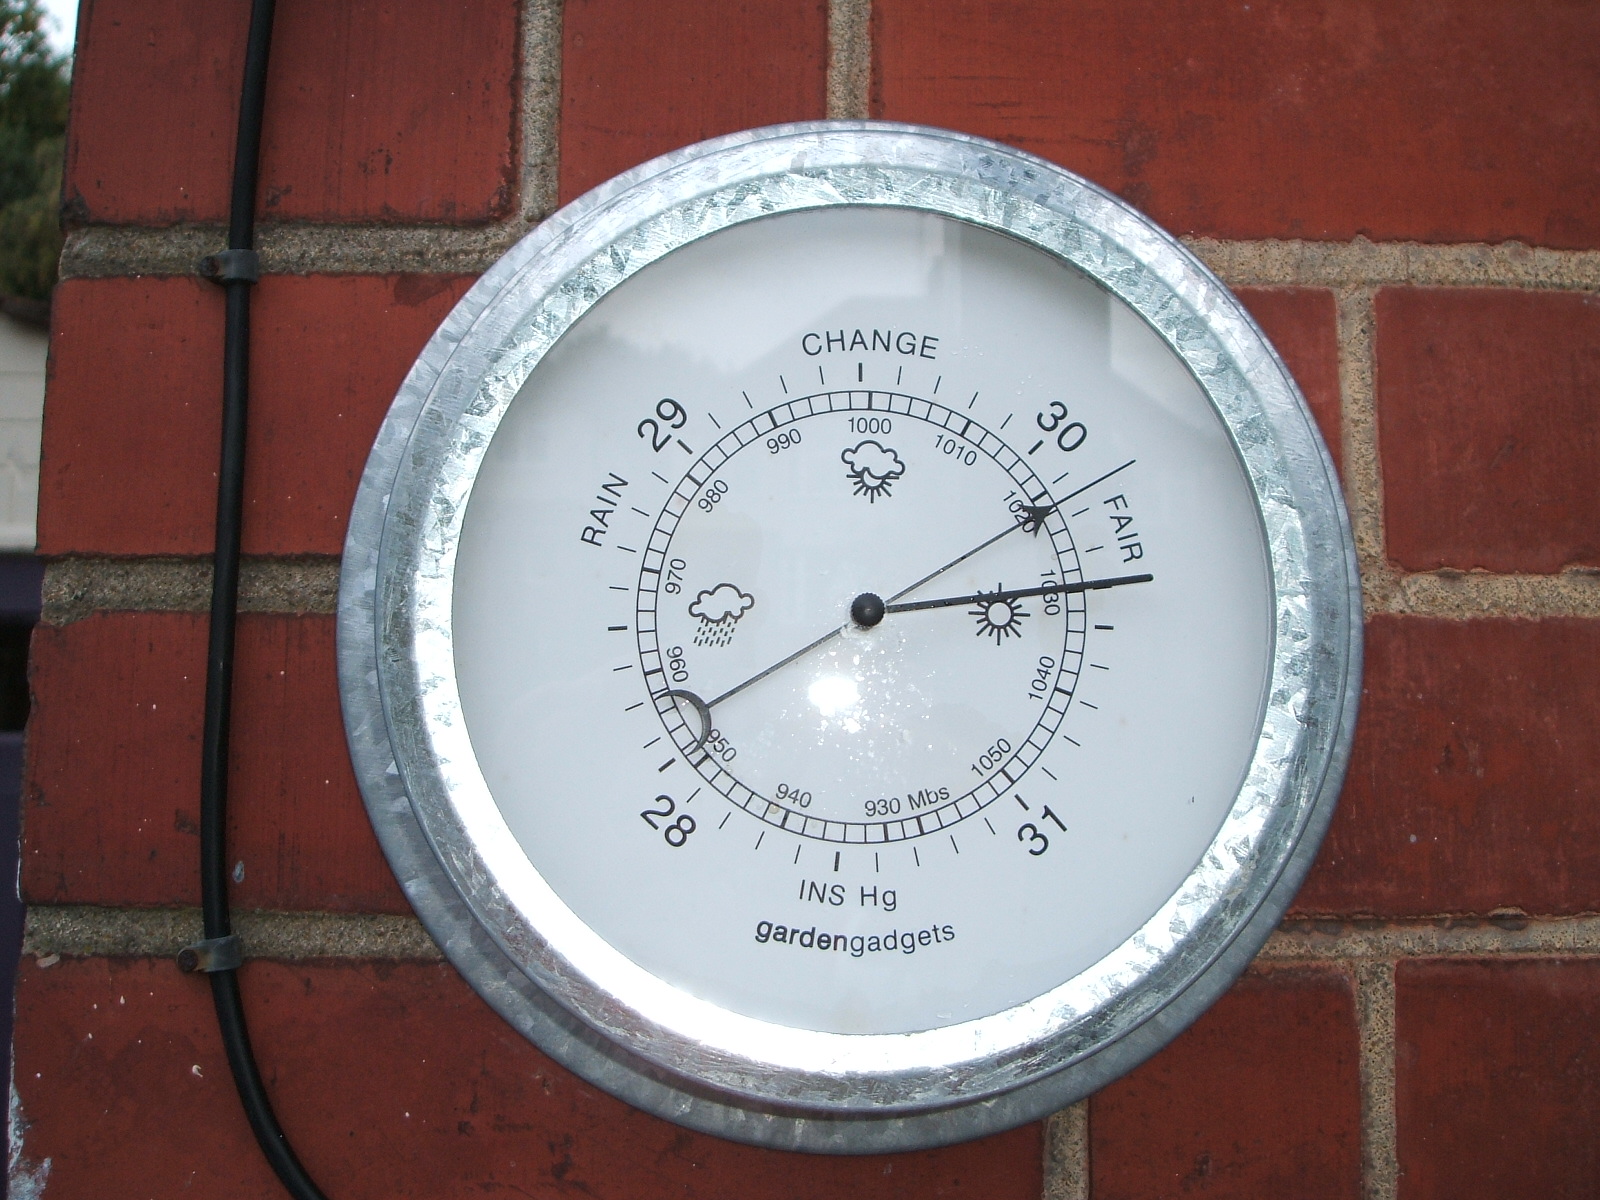
Imagine you have a barometer measuring the air pressure around you. If the barometer is functioning properly, we should observe a tight relationship between the pressure reading on the barometer and the actual air pressure. In other words, air pressure and our barometer reading are highly correlated.
However, if we were to hack the barometer and manually change the measurement it reports, would we expect the pressure in the room to change as a result? Obviously not. Intervening by changing the pressure reading of the barometer does not impact actual air pressure, despite the 1:1 observational correlation between the two. The interventional or causal relationship between the barometer and air pressure is exactly zero in that direction (though there is a very strong causal influence in the other direction, air pressure to barometer reading). The observational relationship breaks down when we interfere with the system.
"In summary, y and x are correlated or statistically dependent and therefore seeing x allows me to predict the value of y, but y is not caused by x so setting the value of x won't affect the distribution of y. Hence, p(y|x) and p(y|do(x)) behave very differently." — ML beyond Curve Fitting
Economists know this as the Lucas Critique, which tells us that attempting to conduct economic policy based on some macroeconomic model trained on observational data will inevitably fail, as the identified relationships disappear into the ether.
The same logic applies to sales and marketing spending. We should not expect magic number, which is effectively a measure of the correlation between New ARR and S&M, to hold constant if we were to purposefully increase S&M. New ARR and S&M can be tightly correlated, and yet the observational correlation between the two breaks down when we intervene. Choosing to, say, double S&M next year does not in any way guarantee that we will book twice as much New ARR. Worse, the breakdown in the relationship tends to go against us — after a significant ramp in expense, sales efficiency almost always ends up being worse than expected, rather than better.
If we are interested in forecasting new revenue based on an intentional choice of S&M spending, magic number won't do. We need to find a better magic number, one that approximates the true causal impact:
"In applications where you ultimately want to control or choose x based on the conditional you estimated, you should seek to estimate p(y|do(x)) instead. For example, if x is a medical treatment and y is the outcome, you are not merely interested in observing a naturally occurring treatment x and predicting the outcome, we want to proactively choose the treatment x given our understanding of how it affects the outcome y." — ML beyond Curve Fitting
Magic multipliers
If you're a regular reader of mine, you'll know that this is the part where we transition from theory to data. Can we identify the true causal impact of S&M on revenue growth?
We can try.
Funnily enough, economists regularly tackle a very similar issue — calculating how much the economy grows when the government spends more money, otherwise known as the "fiscal multiplier." How exactly to calculate these multipliers is a constant debate among economists, but a few methods have emerged with some consensus. Here I will leverage a statistical method called "local projections" which I won't explain in detail here, but I will summarize by saying it enables us to calculate the causal impact of an increase in S&M spend on New ARR over time via a special linear regression. The ratio of the increase in New ARR to the increase in S&M spend yields the "multiplier", or true magic number in our case.
I've assembled a dataset of anonymized quarterly New ARR and sales and marketing spend for a sample of early to mid-stage software companies. This is far from a representative sample of all software vendors, but with 230 data points across 26 companies we can generate insights nonetheless. As evidence of its non-representativeness, the average magic number in my dataset is 2.1. Most companies in fact hover closer to 1, but the logic is the same regardless.
First we'll calculate the impact of an increase in S&M (relative to what it otherwise would have been) on New ARR (again, relative to the counterfactual). We'll recalculate this at various horizons — current quarter (labeled "Q1" below), one quarter out, two quarters out etc (chart on the left). To get the total effect we'll sum up the impacts across quarters (chart on the right):
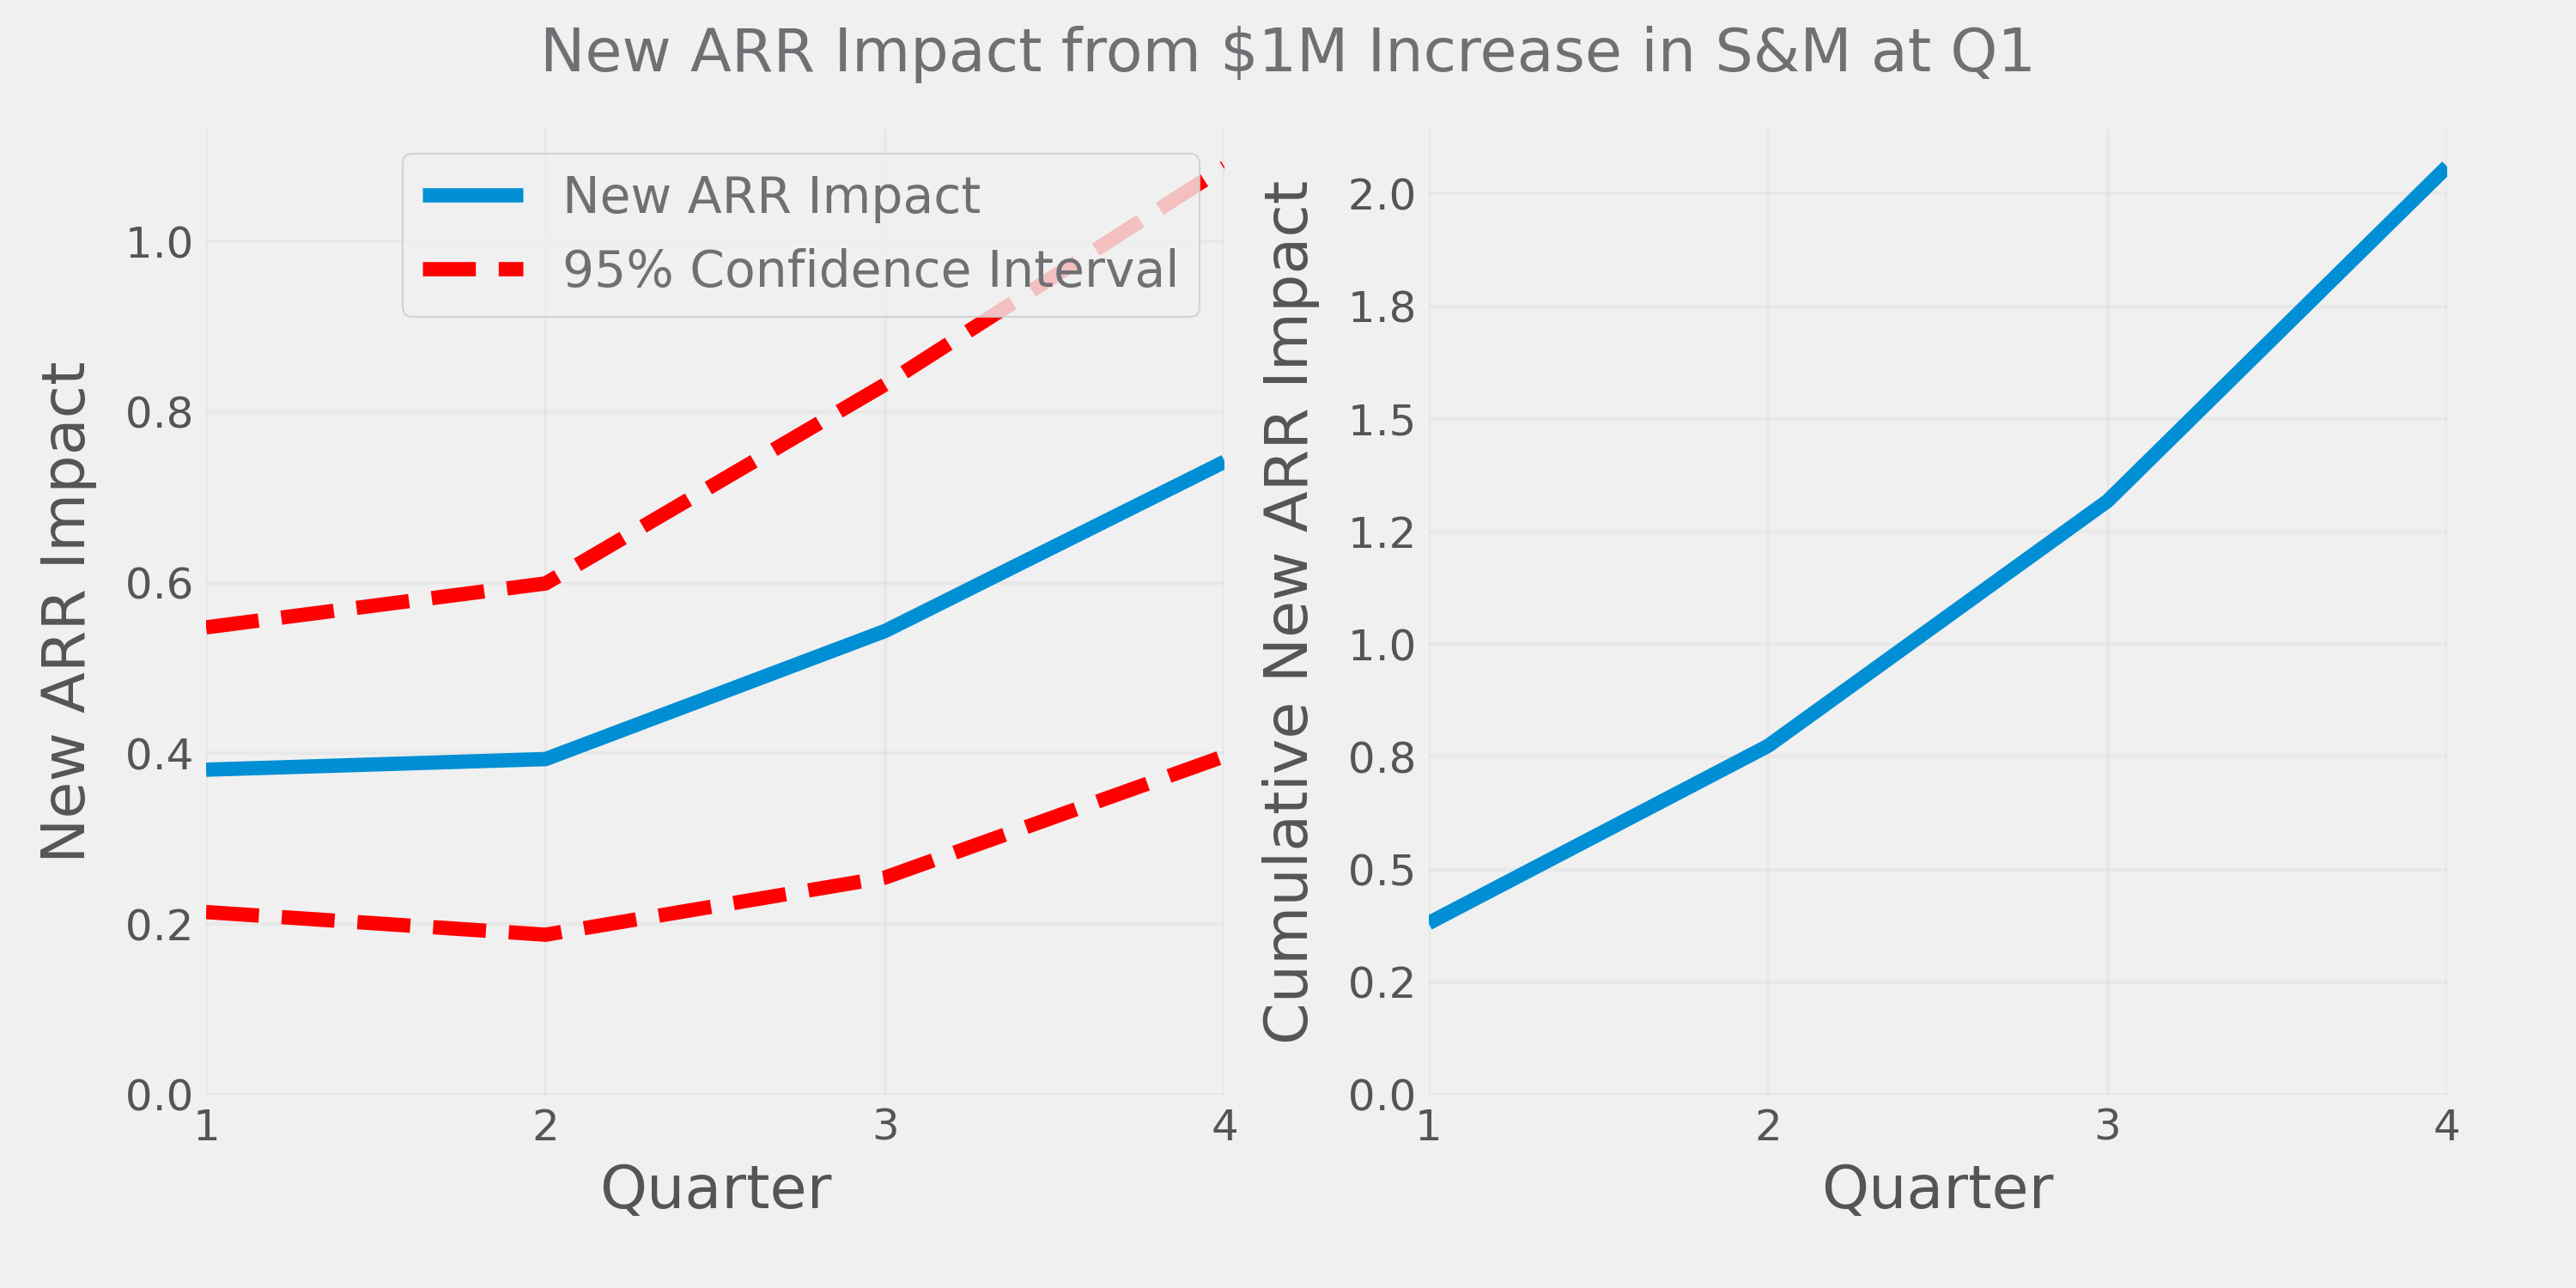
A $1M increase in S&M this quarter generates $0.38 more New ARR that same quarter, $0.39 the next quarter, and so on. Cumulatively, over four quarters this adds up to about $2 of additional New ARR vs. if S&M spend hadn't increased.
Now if this was the entire story we'd say that the true magic number reaches two after four quarters and perhaps continues to increase after that. OK, so perhaps magic number as typically calculated doesn't measure the immediate impact of S&M spending, but it gets there eventually, right?
But it's not the whole story. We've cheated a bit here by only counting the initial $1 bump in S&M spend. But if we increase spending today, spending tomorrow will also be higher. Part of the effect on New ARR we measured above is due to higher spend in the current quarter, but part of it is also driven by higher spend next quarter (and the quarter after that, and so on).
To account for this, we must calculate the effect of S&M this quarter on S&M next quarter AND the quarters thereafter and include the cumulative effect in the denominator of our magic number calculation:
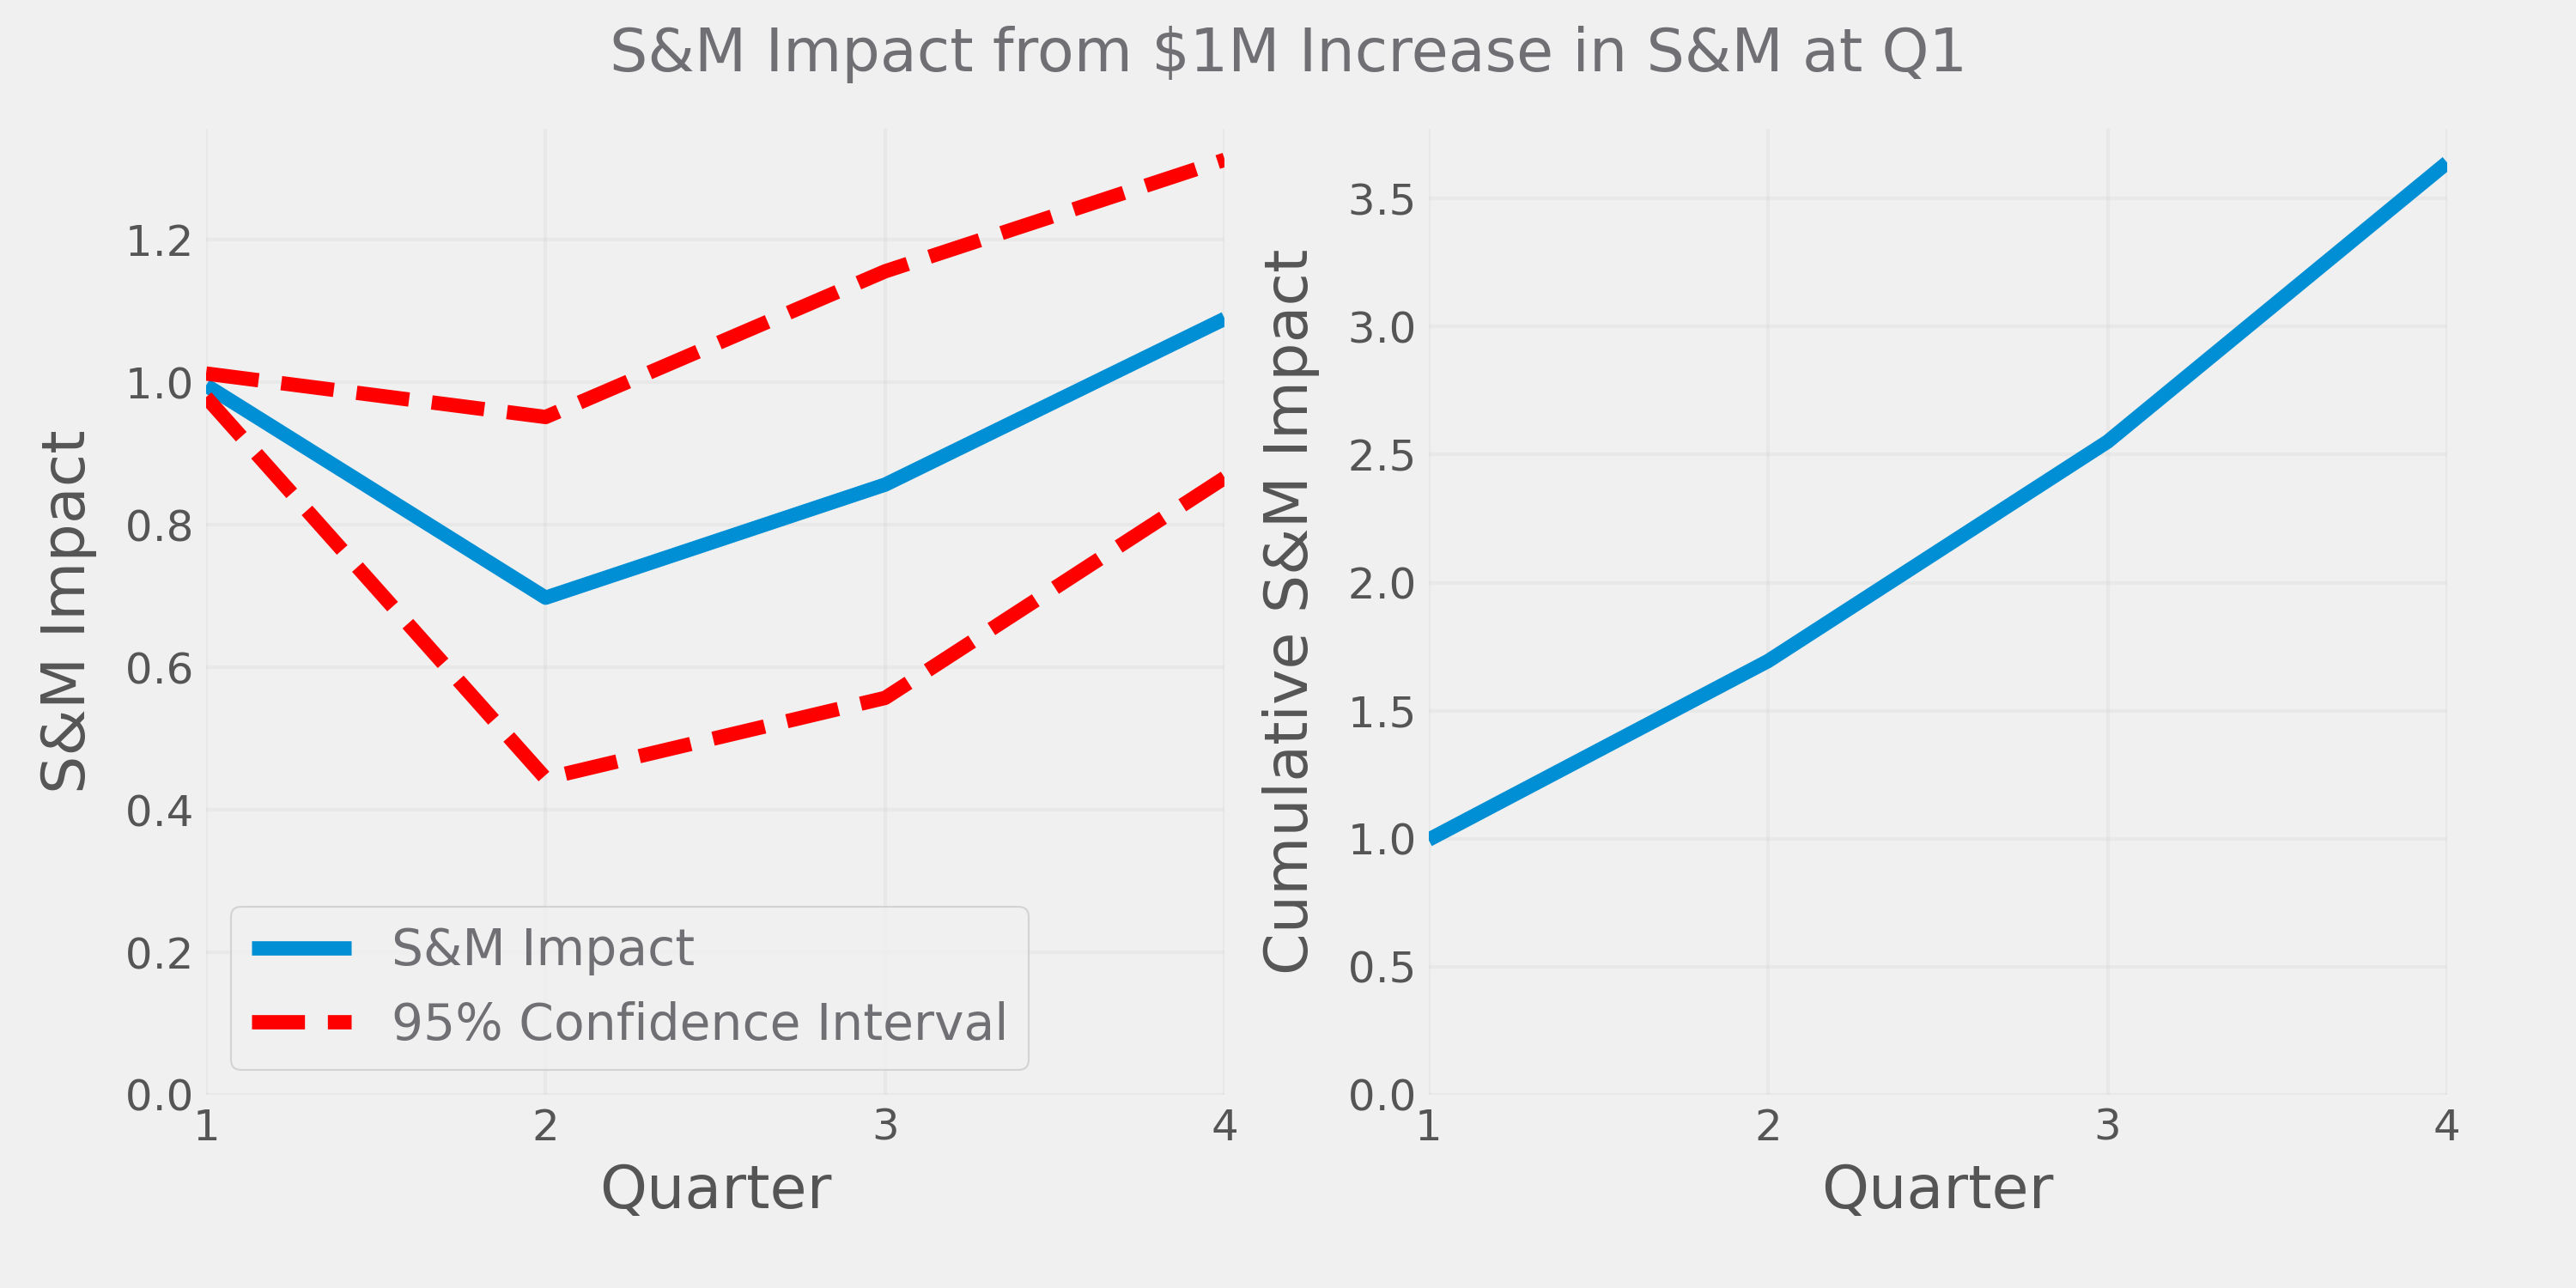
The chart above shows the impact of S&M on itself into the future. A $1 increase this quarter leads to the next quarter being $0.70 higher than it would have otherwise been, $0.86 the quarter after that, and so on. Cumulatively, we spend about $3.5M more after four quarters.
Now we can compare the cumulative effect on New ARR to the cumulative increase in S&M to get a proper measure of the "true" magic number:
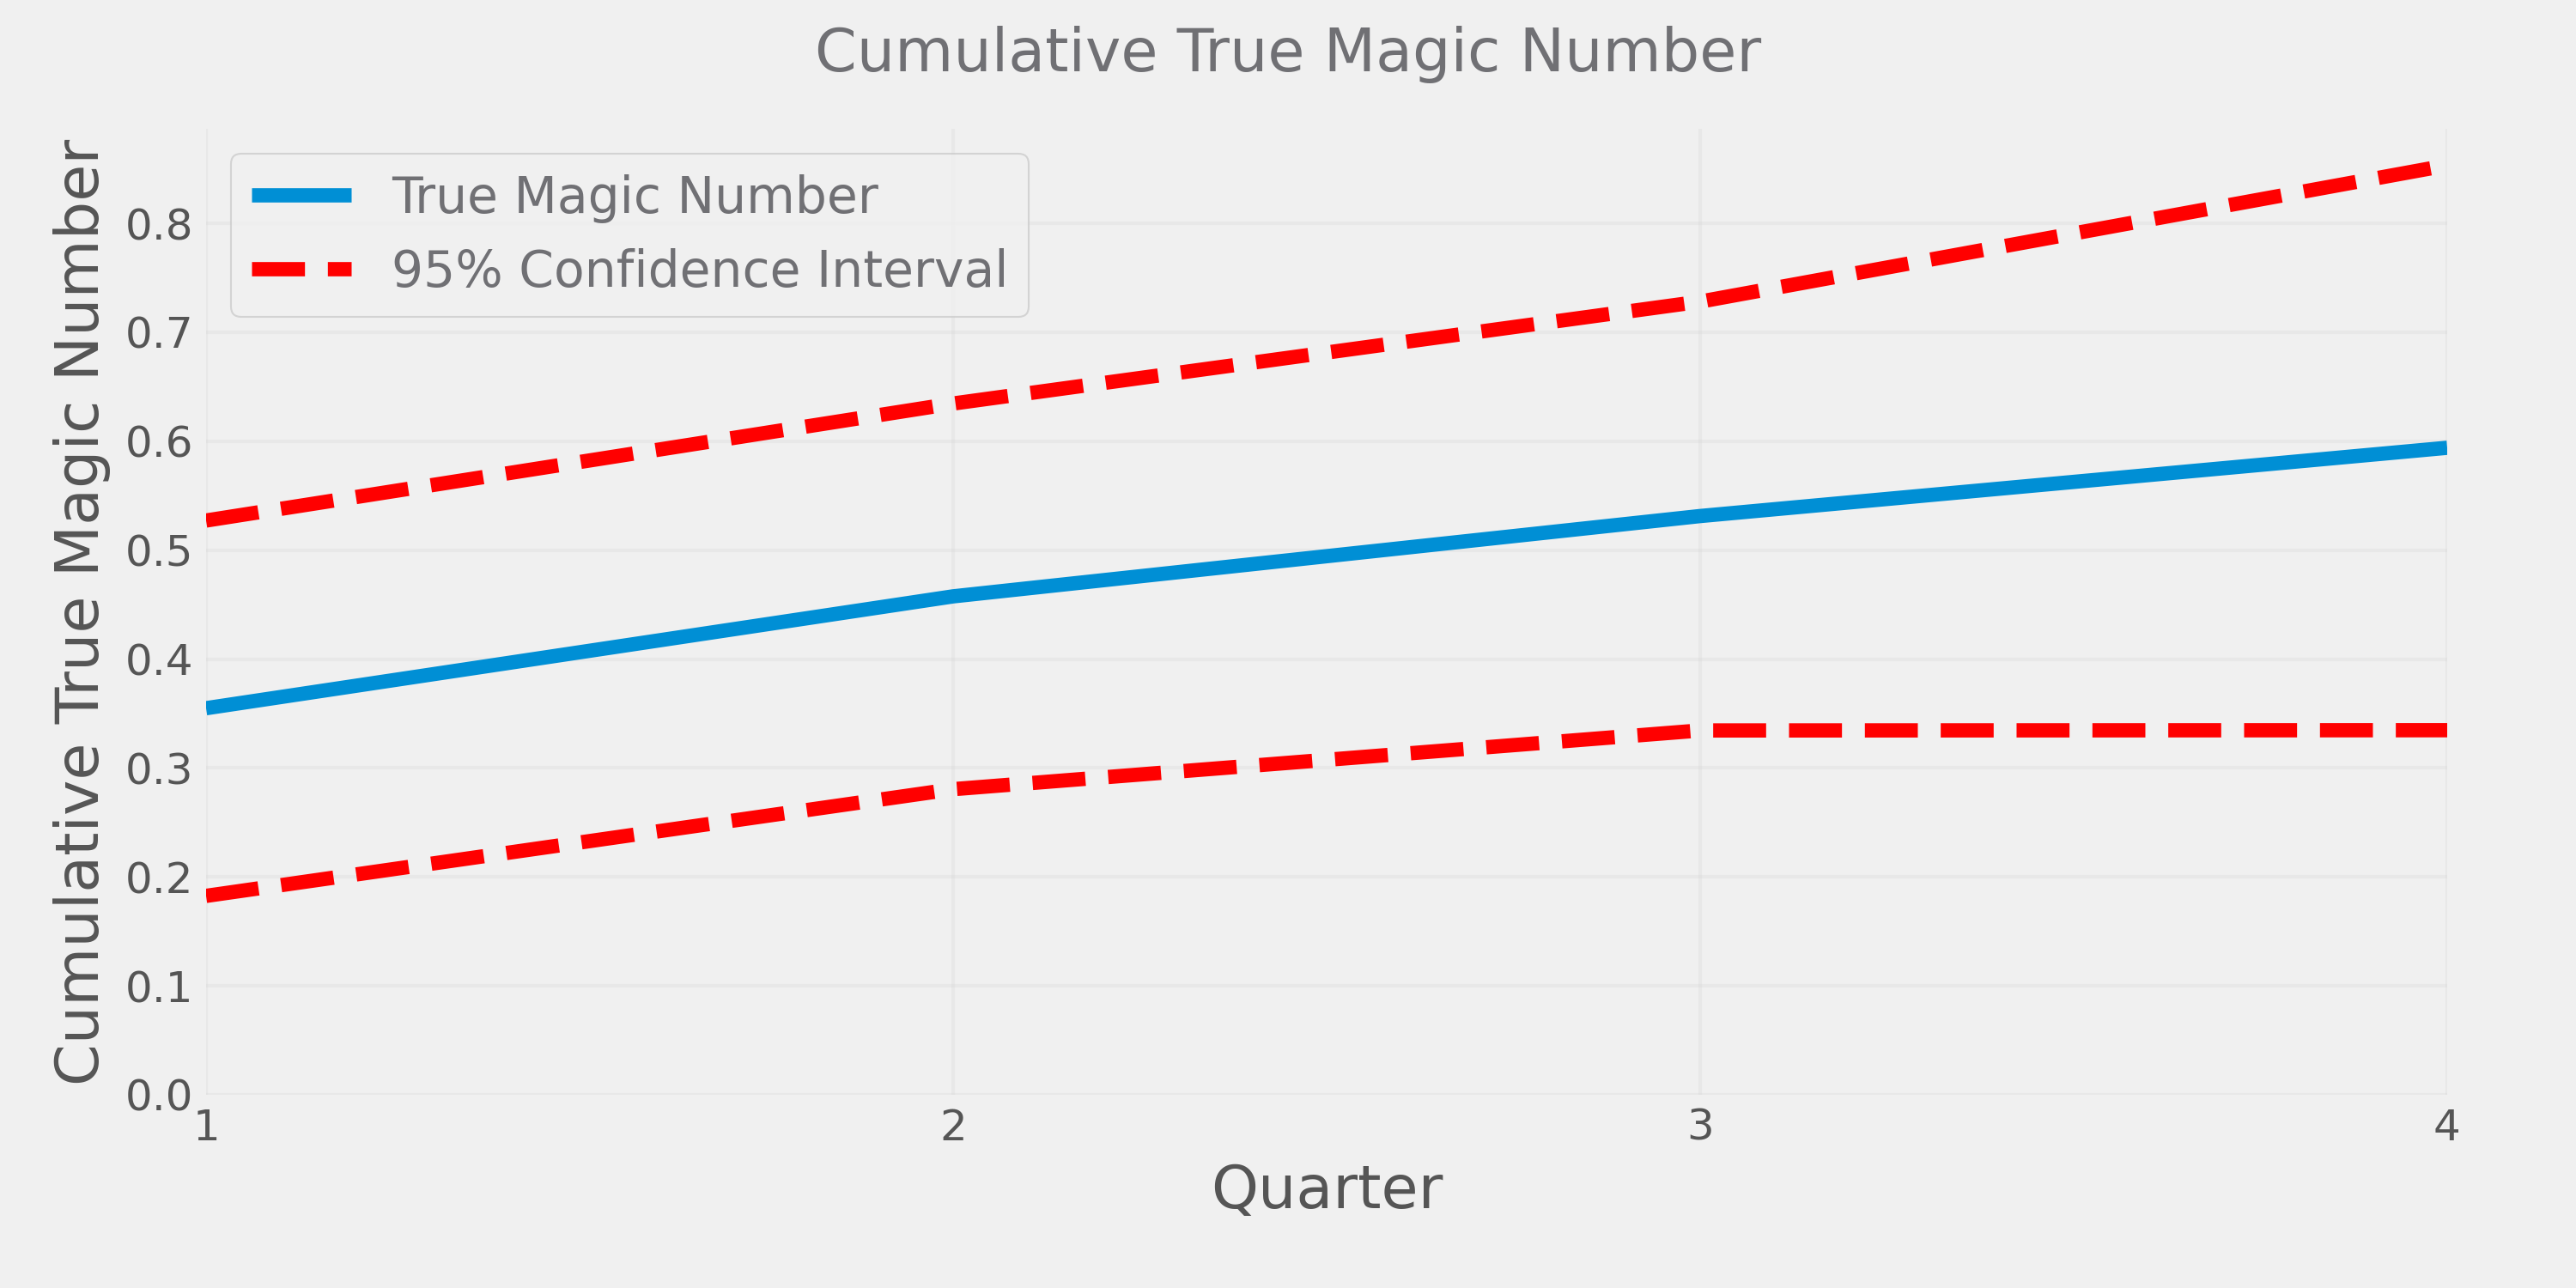
The true magic number is estimated to be only 0.6 after four quarters, this is less than a third of the average magic number in this dataset of 2.1. So not only is the true magic number much lower than the typical calculation, it takes many quarters to reach this much lower cumulative impact. Importantly — we don't get nearly the bang-for-buck that the traditional magic number implies.
To make this real — a forecast that New ARR will be $2.1 higher next quarter based on a $1 increase in S&M this quarter will be off by 80% (per the first chart, New ARR one quarter out is only $0.39 higher) and cumulatively (including the first and second quarter impact) will be off by 78% (based on 0.46 cumulative magic number at Q2).
Magic isn't real
It's worth pointing out some caveats here.
I wasn't able to fully control for the "other stuff" that also drives New ARR. In my regressions I do control for the long-term trends of each variable (via a cubic polynomial time trend interacted with company fixed effects for those who care) which helps account for these unobserved factors, but this is not a perfect solution. I also don't identify a completely exogenous increase in S&M. Inherently, I assume that S&M deviations from trend imply unexpected increases in S&M, but that's also not totally right.
This is amateur econometrics, so it'll do.
My conclusions:
-
Magic number is a bad metric. It misleads us into thinking that by turning some knobs we can precisely control revenue growth. It commits the scandalous statistical sin of mixing correlation and causation
-
S&M alone has little effect on New ARR. Certainly not in the near term and to a much lesser degree than you might think in the longer run
-
We don't really know how to calculate software sales efficiency. This analysis leveraged 230 data points to get some level of certainty, but for any particular company it'd be difficult to replicate with only a few quarters or years of data
So what can we use as an alternative?
I've always liked the easy heuristic of New ARR vs. cash burned. This ignores specific expense line items and gives companies credit for "all-in" capital efficiency, which is arguably what matters most anyway. It avoids the perils of attributing revenue growth to particular initiatives, like sales and marketing or research and development. Of course, we still have an omitted variable problem (burning cash is not the only way to drive revenue growth), but it's much less severe.
3,000 words later, I hope I've convinced you that magic number doesn't tell you much about sales efficiency or productivity. If you've found a better metric, I'd love to hear about it. Feel free to reply to this email.
|

