Coin Metrics' State of the Network: Issue 131
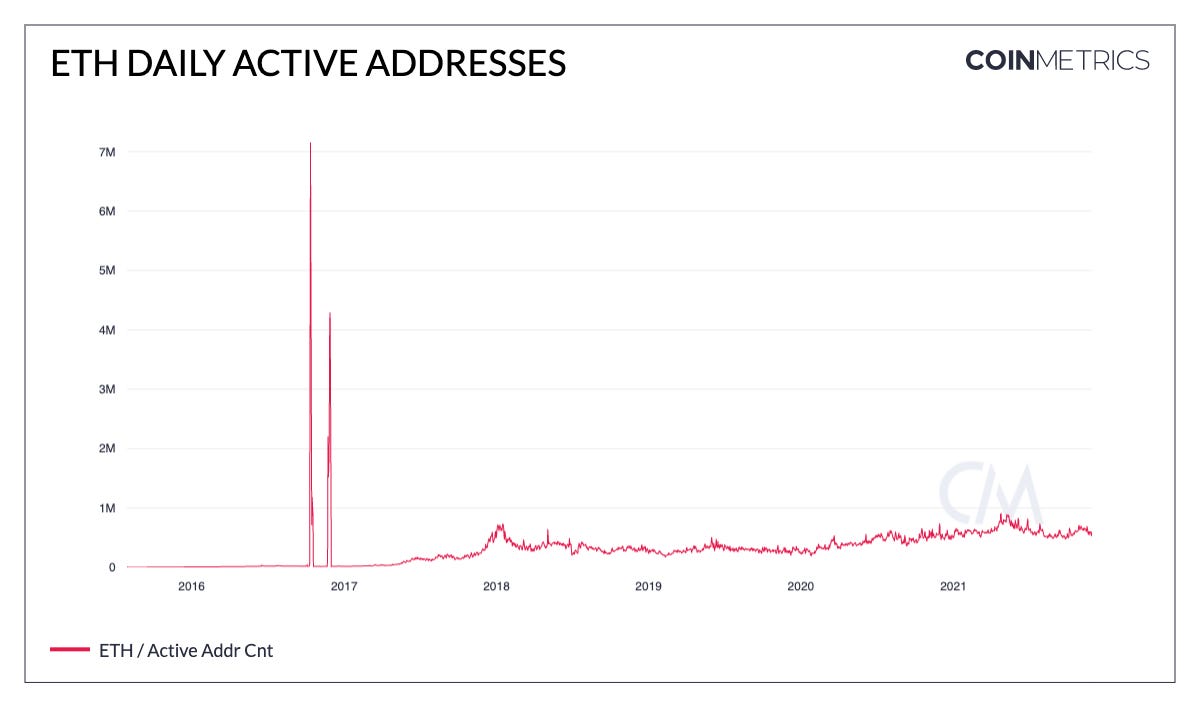
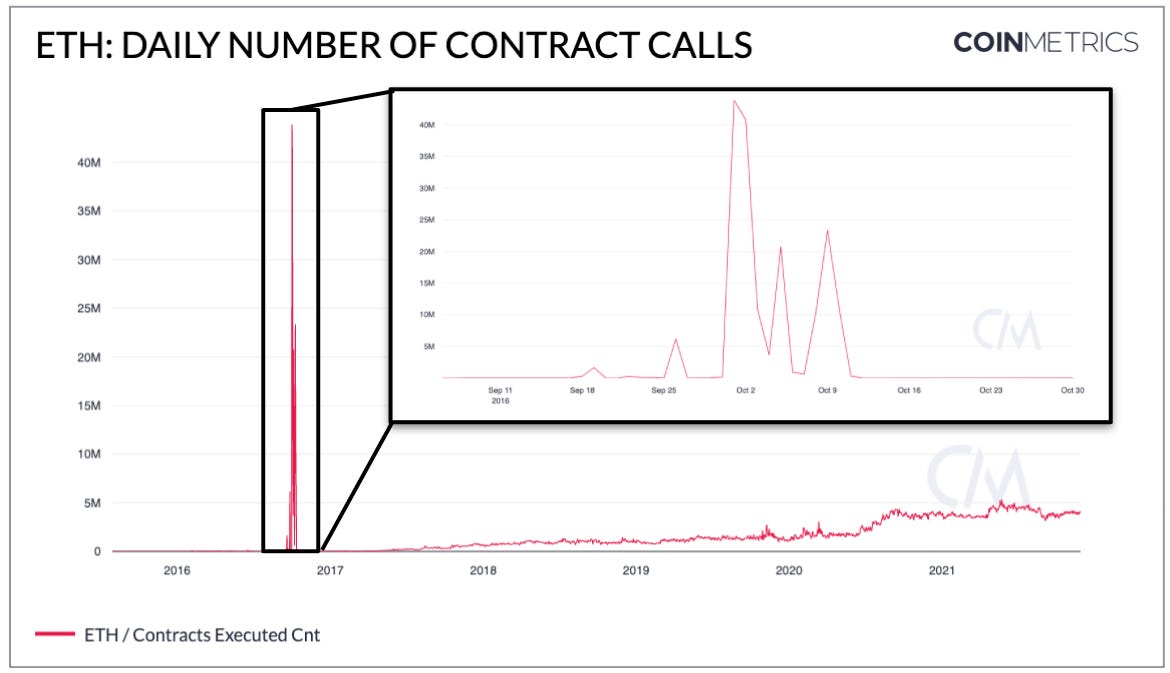
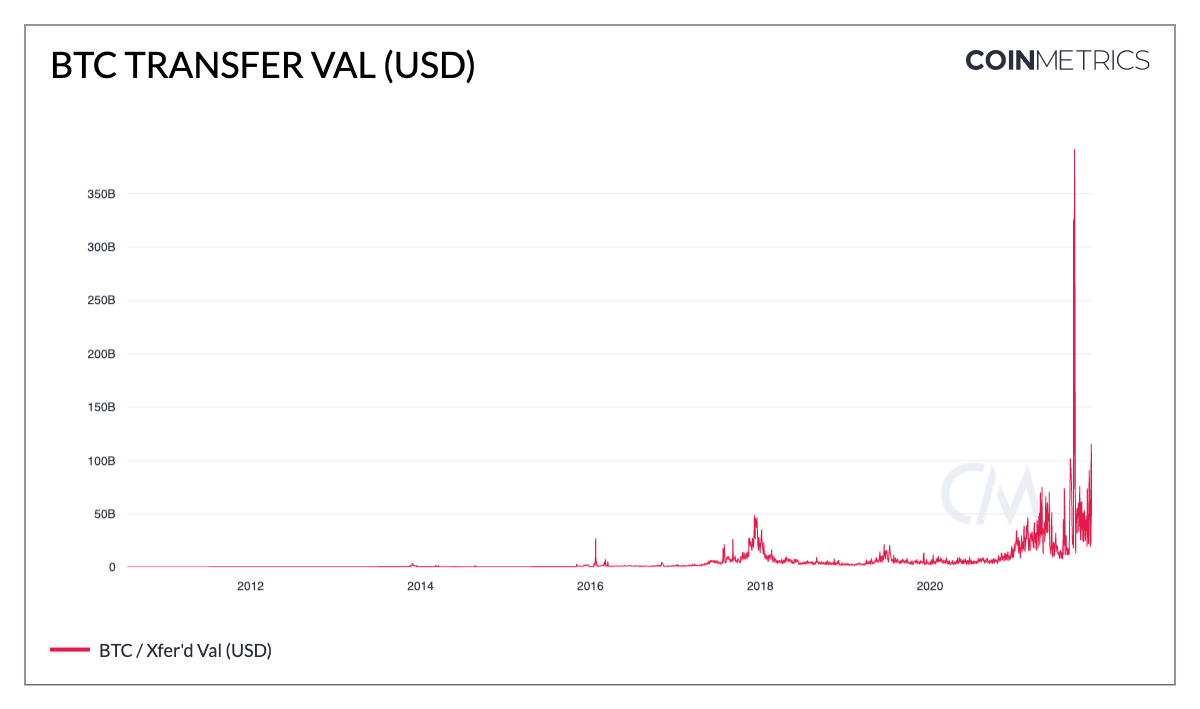
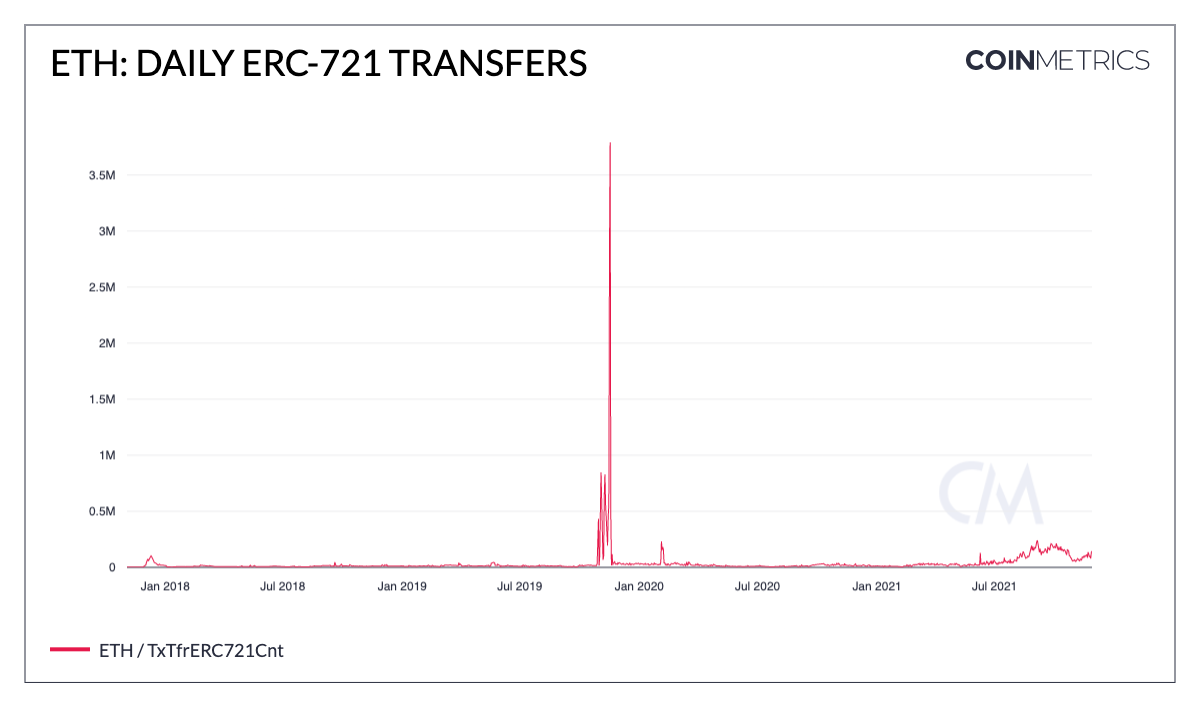
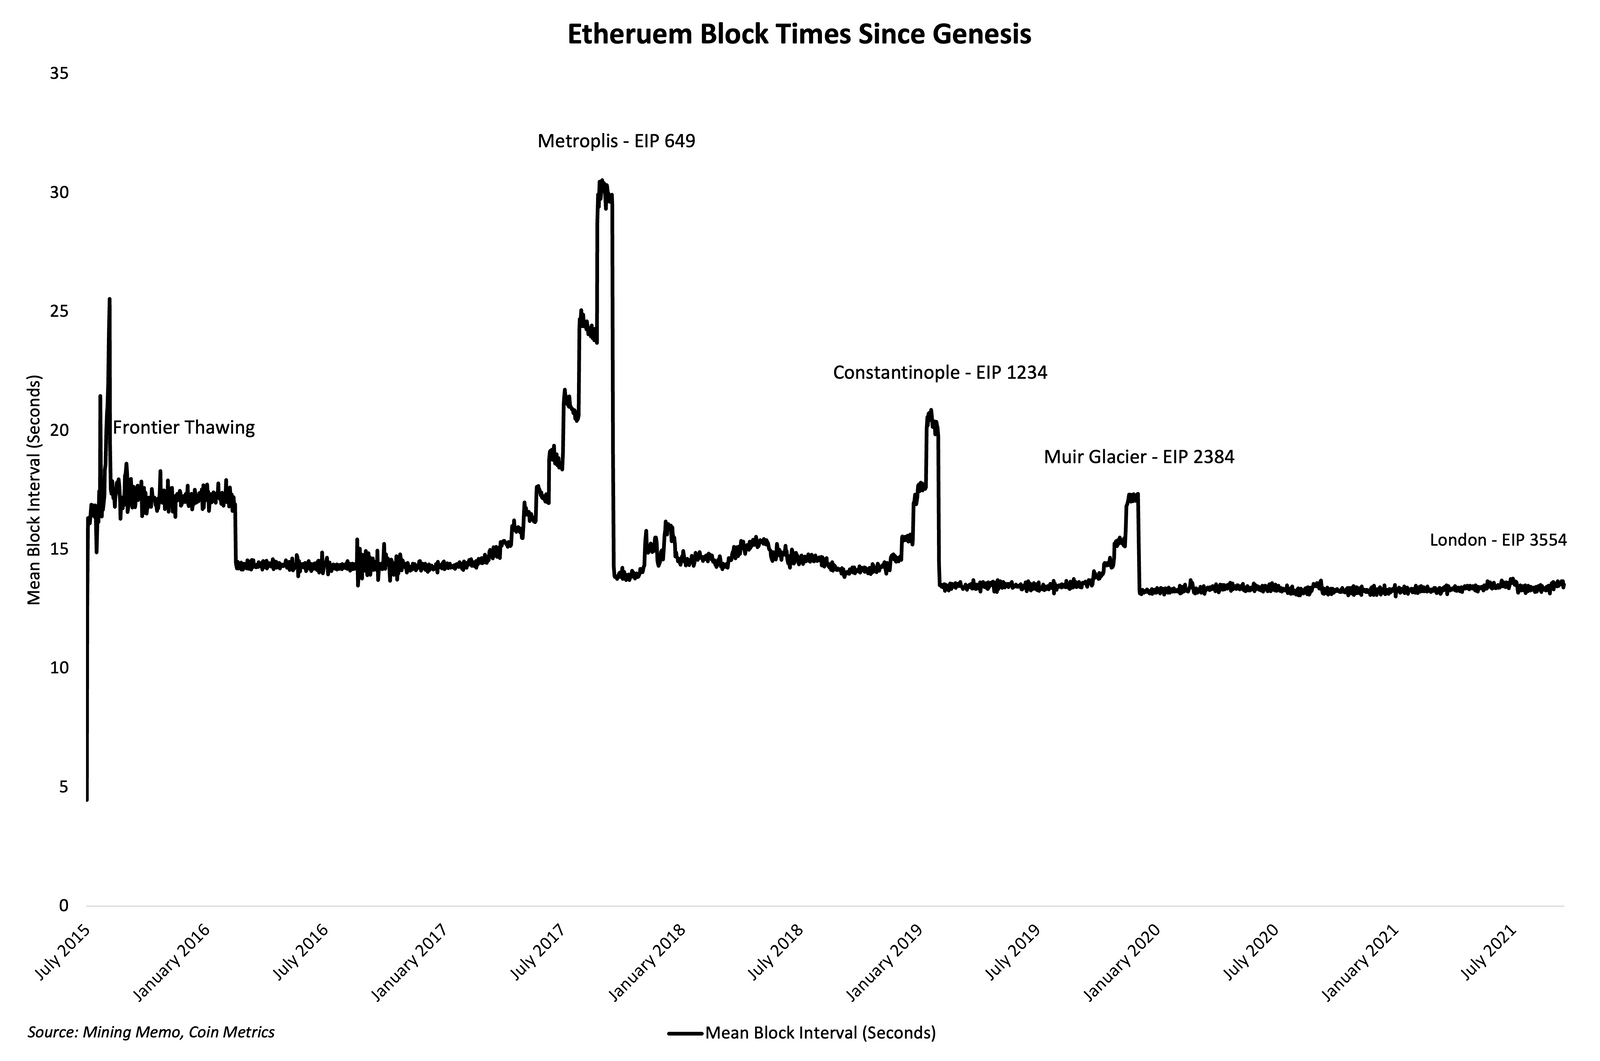
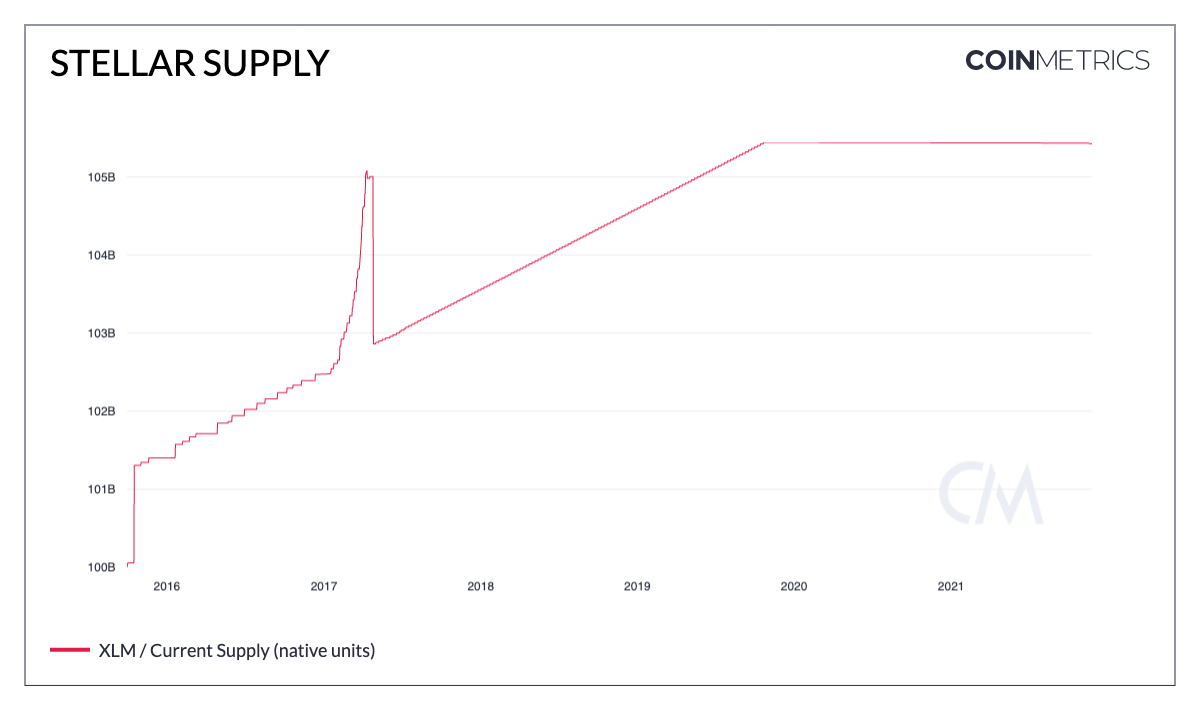
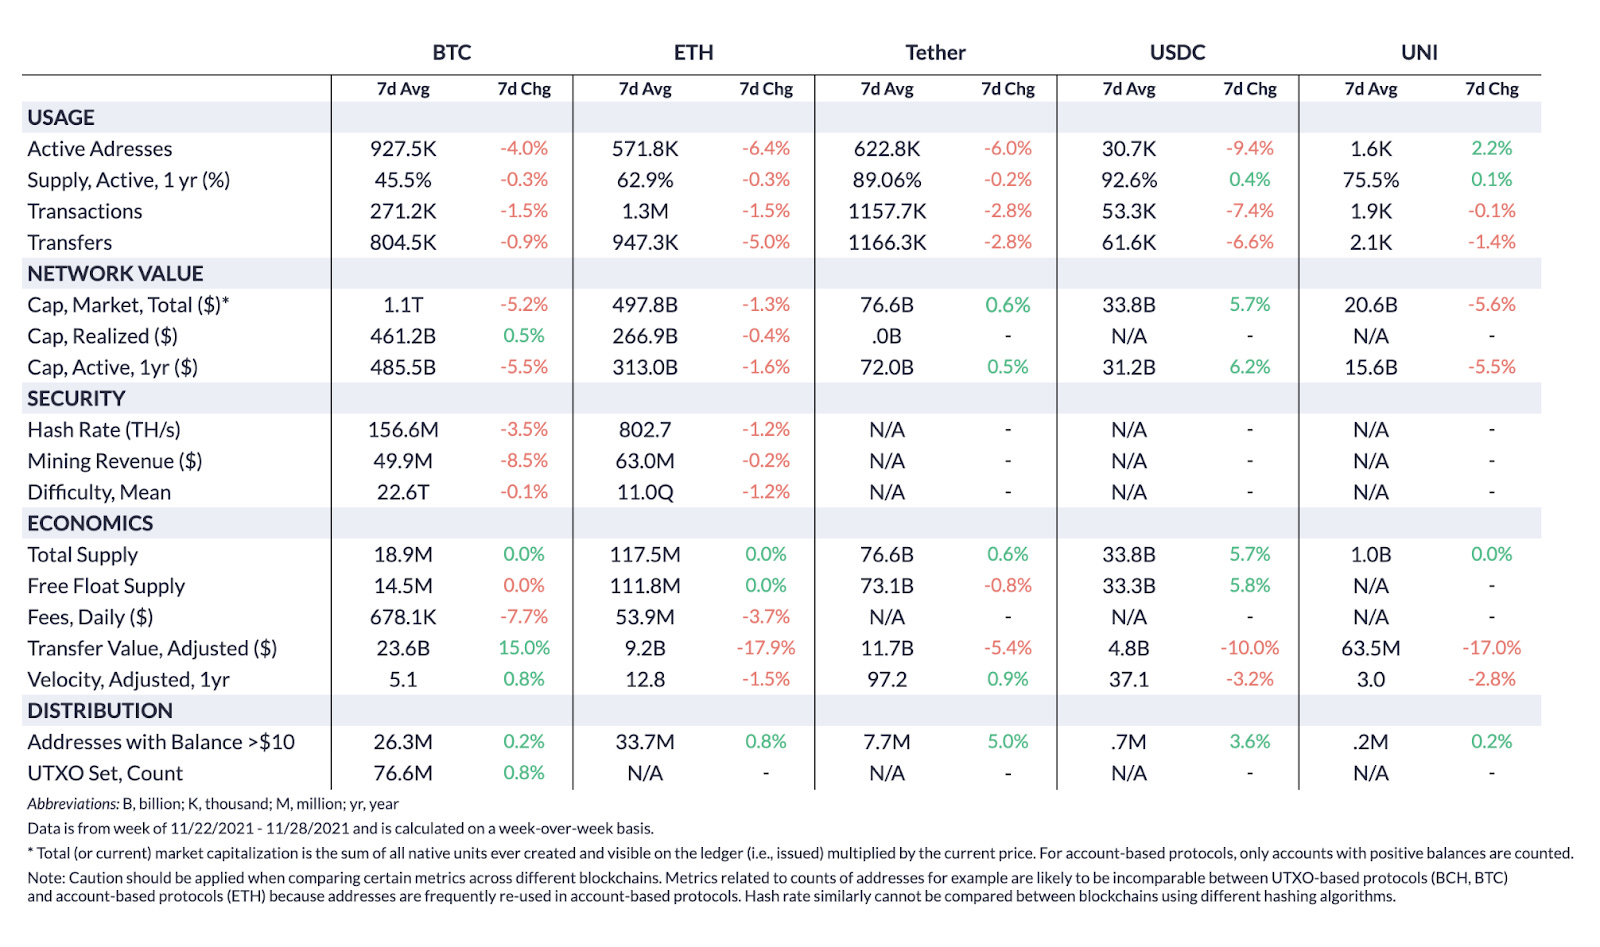
Get the best data-driven crypto insights and analysis every week: Explaining Some of Crypto’s Biggest Data AnomaliesBy Kyle Waters and Nate Maddrey The history of economics and finance is filled with examples of data oddities and irregularities. Numerous economic time series are marked by sudden spikes and abrupt trend reversals. Some better-known examples include fiat currency collapses, financial crises, flash crashes, and other exogenous shocks arising from commodity price increases (e.g. oil) or events like wars and (more pertinently) pandemics. Although crypto is still in its relative infancy, there are already some well-known network/on-chain data and market data anomalies; some that are so exceptional that they may even appear to be bugs to the untrained crypto historian. But like most aberrations in economic history, there are explanations-whether they be benign or extraordinary. However, the novelty of crypto introduces new events to study such as network attacks and software quirks, intentional or otherwise. 2016 Ethereum DoS AttacksDaily active addresses is one of the most popular on-chain measures of network activity and proxy for the number of users on a blockchain. Tracking daily active addresses over time is often a crypto analyst’s starting point for gauging trends in network usage and adoption. But for Ethereum, a few puzzling days towards the end of 2016 invariably throw off newer observers’ analyses of Ethereum user growth since its 2015 genesis. Source: Coin Metrics Network Data Charts On October 10, 2016 there were just about 52 thousand active Ethereum addresses. Just two days later on October 12th, there were just over 7 million. Surely the network’s users couldn’t have increased by over 100X in a matter of days? That intuition would be correct as the millions of new active accounts were empty and generated in connection with an adversarial denial of service (DoS) attack on the network. In a DoS attack, adversaries effectively overwhelm a network with superfluous operations in an attempt to slow or interrupt service for real users. The DoS attacks started in late September 2016 when the attacker(s) identified an operation that was relatively cheap to continually perform (in terms of gas fees) but computationally expensive for nodes in the network to process. The mass influx of contract calls flooded the network and introduced large delays in the processing time for transactions. Short-term fixes were implemented but another attack commenced shortly thereafter lasting for more than a month. The impact of the attack is also apparent in the daily number of smart contract calls on Ethereum which spiked abruptly as the attackers repeatedly spammed the network in September and October of 2016. Source: Coin Metrics Network Data Charts In the end, the attacker’s low-cost transactions created close to 19M empty accounts on the Ethereum blockchain. Ethereum subsequently underwent two hard forks that helped end the attacks and secure the network. The first fork addressed the underpriced operations and the second removed the empty accounts that had bloated the state, or the data that nodes must store on things like Ethereum account balances (note that this wiping of empty accounts is the explanation behind the second anomalous spike in active addresses in November 2016). The 2016 DoS attacks were ultimately a resiliency test for Ethereum. Given the extreme nature of the event and the low likelihood of it happening again, it is recommended that analyses of Ethereum adoption and usage correct for or exclude this outlier time period. On-chain Transfer AnomaliesAnother metric in crypto that is susceptible to abrupt outliers is daily transfers recorded on-chain. Recently, on an unadjusted basis in dollar terms, BTC transfer value skyrocketed on September 14th to over $350B. Source: Coin Metrics Network Data Charts There’s certainly a level of intrigue with such a sudden increase, but oftentimes the cause itself is more innocuous. For example, this particular increase was likely associated with a reshuffling of bitcoin held by FTX. Exchanges are often the entities behind these transfer value outliers as they will occasionally move large sums of coins internally to meet withdrawal needs or to reshuffle cold wallets. For this reason, it is often better to look at adjusted transfer figures that remove economically insignificant activity and self-churn. NFT transfers on Ethereum offer another example. Although NFTs have had a breakout year, the rise of NFTs in 2021 is overshadowed by a short-lived, extreme upward spike in daily NFT transfers in late 2019. Source: Coin Metrics Formula Builder During the peak of this year’s NFT mania, there were ~240K transfers of ERC-721 tokens recorded on September 5th, which was more than 20X the daily average in January of this year. But moving back the data series to the beginning of the ERC-721 standard in 2017, there were ~3.8M transfers of NFTs on Ethereum on November 19, 2019. The origin of this anomaly was the NFT trading card game Gods Unchained. The game’s cards were previously stored off-chain and were then “activated” (i.e. minted) all at once, causing a sudden wave of on-chain transfers. Given the scope of the project and the staggering number of NFTs, Gods Unchained has since transitioned to Immutable X, a L2 scaling solution that the team behind Gods Unchained has developed for NFTs on Ethereum. Ethereum Difficulty Time BombThe transition from a Proof-of-Work (PoW) to Proof-of-Stake (PoS) consensus mechanism has long been a stated goal for Ethereum, even dating back prior to the network’s genesis. In an effort to hold developers, miners, and users accountable to a quick PoS timeline, an early 2015 update to the protocol introduced a (now infamous) feature known as the “difficulty bomb”. In PoW, the difficulty parameter sets how computationally hard it is for miners to add new blocks to the chain. The difficulty regularly adjusts to target a desired time between blocks (10 minutes for Bitcoin, ~13.5 seconds for Ethereum). With the difficulty bomb, the idea is that the mining difficulty on Ethereum will exponentially increase to the point where miners can no longer find new blocks thereby enforcing a move to PoS. But as Ethereum’s timeline for PoS has shifted, the difficulty bomb has continually been disarmed-however not before leaving an imprint on historical block times. The chart below shows the mean block time over the course of Ethereum’s history, with ascents and steep declines as the difficulty bomb neared and was delayed via hard forks of the network. While menacing, the difficulty bomb has now served more of a procedural role requiring ETH core developers to periodically kick the proverbial can down the road (for example, the bomb will be delayed again on December 8th until June 2022). Interestingly, it has also served an additional function of forcing those who want to keep running Ethereum to have to upgrade their nodes. But given the recent progress towards Ethereum’s PoS transition, the difficulty bomb on the Ropsten test network will notably not be delayed as developers intend to try and run PoS on the testnet before the bomb goes off. Stellar Inflation BugSoftware bugs are another source of crypto data anomalies. In 2017, Stellar suffered an inflation bug in which 2.2B XLM were created in an exploit resulting in a clear deviation from the XLM supply schedule. Source: Coin Metrics Network Data Charts The Stellar Development Foundation publicly disclosed and patched the bug and took the additional step of burning XLM it held in reserve to return supply to its predetermined schedule. ConclusionThe examples above are some of the largest data anomalies crypto analysts often encounter but this list is not meant to be exhaustive. Other data anomalies can arise from crypto-native mechanisms like flash loans in DeFi; a recent example being the CryptoPunk that “sold” for $532M. Much like the traditional financial markets (e.g. May 2010 Flash Crash), crypto markets have also featured their fair share of mispricings and dislocations. Ultimately, crypto markets and blockchains are producing data nonstop and are bound to emit statistical outliers-sometimes these figures will carry signals but many times they will simply be noise. To follow the data used in this piece and explore our other on-chain metrics check out our free charting tool, formula builder, correlation tool, and mobile apps. Network Data InsightsSummary MetricsSource: Coin Metrics Network Data Pro It was a tumultuous Thanksgiving break for BTC and the rest of the crypto market. On Friday, November 26th BTC market cap dropped by over $1B as the stock market had one of its worst days of the year due to uncertainty over the Omicron COVID-19 variant. But by Monday the market began to rebound as panic subsided. Overall, BTC’s market cap dropped by 5.2% week-over-week, while ETH’s dropped by 1.3%. On-chain usage also dropped for both networks, with BTC down 4% and ETH down by 6.4%. Network HighlightsAlthough it might be too early to call a definite trend, Bitcoin’s hash rate has fallen slightly in the last few weeks. However, hash rate is still far above this year’s trough induced from the miner crackdown in China. See more in our weekly summary video below:   Coin Metrics UpdatesThis week’s updates from the Coin Metrics team:
As always, if you have any feedback or requests please let us know here. Subscribe and Past IssuesCoin Metrics’ State of the Network, is an unbiased, weekly view of the crypto market informed by our own network (on-chain) and market data. If you'd like to get State of the Network in your inbox, please subscribe here. You can see previous issues of State of the Network here. Check out the Coin Metrics Blog for more in depth research and analysis. © 2021 Coin Metrics Inc. All rights reserved. Redistribution is not permitted without consent. This newsletter does not constitute investment advice and is for informational purposes only and you should not make an investment decision on the basis of this information. The newsletter is provided “as is’ and Coin Metrics will not be liable for any loss or damage resulting from information obtained from the newsletter. If you liked this post from Coin Metrics' State of the Network, why not share it? |
Older messages
Coin Metrics' State of the Network: Issue 130
Tuesday, November 23, 2021
Tuesday, November 23rd, 2021
Coin Metrics' State of the Network: Issue 129
Tuesday, November 16, 2021
Tuesday, November 16th, 2021
Coin Metrics' State of the Network: Issue 128
Tuesday, November 9, 2021
Tuesday, November 9th, 2021
Coin Metrics' State of the Network: Issue 127
Tuesday, November 2, 2021
Tuesday, November 2nd, 2021
Coin Metrics' State of the Network: Issue 126
Tuesday, October 26, 2021
Tuesday, October 26th, 2021
You Might Also Like
Central African Republic’s CAR memecoin raises scrutiny
Friday, February 14, 2025
Allegations of deepfake videos and opaque token distribution cast doubts on CAR's ambitious memecoin project. ͏ ͏ ͏ ͏ ͏ ͏ ͏ ͏ ͏ ͏ ͏ ͏ ͏ ͏ ͏ ͏ ͏ ͏ ͏ ͏ ͏ ͏ ͏ ͏ ͏ ͏ ͏ ͏ ͏ ͏ ͏ ͏ ͏ ͏ ͏ ͏ ͏ ͏ ͏ ͏ ͏ ͏ ͏ ͏
January CEX Data Report: Significant Declines in Trading Volume Across Major CEXs, Spot Down 25%, Derivatives Down…
Friday, February 14, 2025
According to data collected by the WuBlockchain team, spot trading volume on major central exchanges in January 2025 decreased by 25% compared to December 2024. ͏ ͏ ͏ ͏ ͏ ͏ ͏ ͏ ͏ ͏ ͏ ͏ ͏ ͏ ͏ ͏ ͏ ͏ ͏ ͏
Previewing Coinbase Q4 2024 Earnings
Friday, February 14, 2025
Estimating Coinbase's Transaction and Subscriptions & Services Revenue in Q4 2024 ͏ ͏ ͏ ͏ ͏ ͏ ͏ ͏ ͏ ͏ ͏ ͏ ͏ ͏ ͏ ͏ ͏ ͏ ͏ ͏ ͏ ͏ ͏ ͏ ͏ ͏ ͏ ͏ ͏ ͏ ͏ ͏ ͏ ͏ ͏ ͏ ͏ ͏ ͏ ͏ ͏ ͏ ͏ ͏ ͏ ͏ ͏ ͏ ͏ ͏ ͏ ͏ ͏ ͏ ͏ ͏
ADA outperforms Bitcoin as Grayscale seeks approval for first US Cardano ETF in SEC filing
Friday, February 14, 2025
Grayscale's Cardano ETF filing could reshape ADA's market position amid regulatory uncertainty ͏ ͏ ͏ ͏ ͏ ͏ ͏ ͏ ͏ ͏ ͏ ͏ ͏ ͏ ͏ ͏ ͏ ͏ ͏ ͏ ͏ ͏ ͏ ͏ ͏ ͏ ͏ ͏ ͏ ͏ ͏ ͏ ͏ ͏ ͏ ͏ ͏ ͏ ͏ ͏ ͏ ͏ ͏ ͏ ͏ ͏ ͏ ͏ ͏
AI project trading tips: investment targets and position management
Friday, February 14, 2025
This interview delves into the investment trends, market landscape, and future opportunities within AI Agent projects. ͏ ͏ ͏ ͏ ͏ ͏ ͏ ͏ ͏ ͏ ͏ ͏ ͏ ͏ ͏ ͏ ͏ ͏ ͏ ͏ ͏ ͏ ͏ ͏ ͏ ͏ ͏ ͏ ͏ ͏ ͏ ͏ ͏ ͏ ͏ ͏ ͏ ͏ ͏ ͏ ͏
DeFi & L1L2 Weekly — 📈 Polymarket recorded a new high of 462.6k active users in Jan despite volume dip; Holesky a…
Friday, February 14, 2025
Polymarket recorded a new high of 462600 active users in January despite volume dip; Holesky and Sepolia testnets are scheduled to fork in Feb and Mar for Ethereum's Pectra upgrade. ͏ ͏ ͏ ͏ ͏ ͏ ͏ ͏
Donald Trump taps crypto advocate a16z’s Brian Quintenz for CFTC leadership
Friday, February 14, 2025
Industry leaders back Brian Quintenz's nomination, highlighting his past efforts at the CFTC and potential to revamp crypto oversight. ͏ ͏ ͏ ͏ ͏ ͏ ͏ ͏ ͏ ͏ ͏ ͏ ͏ ͏ ͏ ͏ ͏ ͏ ͏ ͏ ͏ ͏ ͏ ͏ ͏ ͏ ͏ ͏ ͏ ͏ ͏
⚡10 Tips to Make a Living Selling Info Products
Friday, February 14, 2025
PLUS: the best links, events, and jokes of the week → ͏ ͏ ͏ ͏ ͏ ͏ ͏ ͏ ͏ ͏ ͏ ͏ ͏ ͏ ͏ ͏ ͏ ͏ ͏ ͏ ͏ ͏ ͏ ͏ ͏ ͏ ͏ ͏ ͏ ͏ ͏ ͏ ͏ ͏ ͏ ͏ ͏ ͏ ͏ ͏ ͏ ͏ ͏ ͏ ͏ ͏ ͏ ͏ ͏ ͏ ͏ ͏ ͏ ͏ ͏ ͏ ͏ ͏ ͏ ͏ ͏ ͏ ͏ ͏ ͏ ͏ ͏ ͏ ͏ ͏ ͏ ͏ ͏ ͏
Interview with CryptoD: How He Made $17 Million Profit on TRUMP Coin
Friday, February 14, 2025
Author | WUblockchain, Foresight News ͏ ͏ ͏ ͏ ͏ ͏ ͏ ͏ ͏ ͏ ͏ ͏ ͏ ͏ ͏ ͏ ͏ ͏ ͏ ͏ ͏ ͏ ͏ ͏ ͏ ͏ ͏ ͏ ͏ ͏ ͏ ͏ ͏ ͏ ͏ ͏ ͏ ͏ ͏ ͏ ͏ ͏ ͏ ͏ ͏ ͏ ͏ ͏ ͏ ͏ ͏ ͏ ͏ ͏ ͏ ͏ ͏ ͏ ͏ ͏ ͏ ͏ ͏ ͏ ͏ ͏ ͏ ͏ ͏ ͏ ͏ ͏ ͏ ͏ ͏ ͏ ͏ ͏ ͏ ͏ ͏ ͏

