Course: Creating and publishing data sources in Tableau
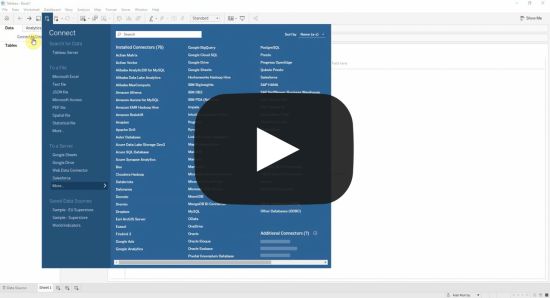
Course: Creating and publishing data sources in TableauIn this course we look at creating, enriching and publishing a trusted and governed data source that we can use in our own analysis as well as making it available for other users to utilise too.This Week’s ProjectFor this week’s project we’re going to be creating a curated data source that other users in our organisation can then use for their own analysis and reports. If you’re using Tableau in an organisation you may be responsible for managing particular data sources or providing access to that data to others within your organisation. Creating a curated data source means you can create a consistent data source that users can trust is correct, of good quality and is governed so that their analysis is accurate. It also makes it easier for users to know which data to use and ensures everyone is using the same data in a consistent way for a given topic. By doing most of the work up front to prepare, clean and size the data also saves your organisation time as the same steps don’t need to be done by each user every time the data is used or refreshed and you can provide regular updates Throughout this project we’ll also take a look at connecting to various data sources within Tableau Desktop including:
In addition we’ll look at:
Required Data:The files you need for this can be found in the Course Data Files folder for this project. You’ll need to download a copy of each of the files in this folder. The Optional Data folder contains some data which you can use if you would like to follow along with the steps in that stage of the course where we look at connecting to databases and Google Drive. You can simply upload the Database Data into your database (if you have one to use) and copy the Google Drive Data into your Google Drive. If you do wish to follow along with the steps that require connecting to a system/database and you don’t already have one here is where you can create each:
Please note: Most of these connectors are only available within Tableau Desktop and not Tableau Public, if using Tableau Public or you don’t have access to these systems you can still see the steps to connect to them throughout the course. SolutionThe curated data source that we’re going to create is going to cover our sales orders for the current calendar year, we’re also going to add in data on returns as well as the sales territories and sales people each customer and account is linked to. Once complete the curated data source will provide all the data our users need in order to analyse sales performance within our organisation. The steps below take you through how to connect to each data source, combine and enhance your data and then prepare and publish as a curated data source. Each step has detailed instructions the first time you come across a new item/function within the course, the accompanying videos then show you a demonstration of going through the steps.
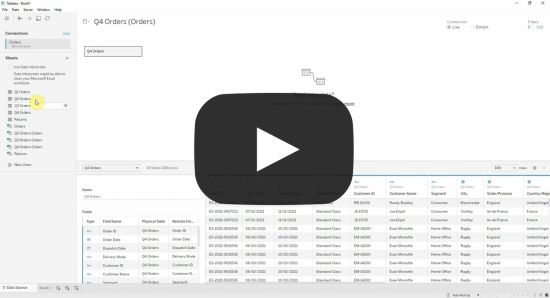
Section 1 - Connecting to local data files on your computer or a shared network drive1. Connect to a single table of data from MS ExcelTo start with we’re going to connect to data which is contained in a Microsoft Excel spreadsheet. This is very common requirement with Tableau, if you’re using Tableau at work you may connect to databases more often but it’s highly unlikely you’ll never have to connect to an Excel file! Our data is contained in a file called Orders.xlsx which contains a sheet with the orders for each quarter within the year and another sheet which lists all the orders that have been returned. Let’s begin by getting this data into Tableau.
You should now see a preview of the Q4 orders data at the bottom of the screen in the data grid as well as a summary of the columns/fields in your data in the meta data grid (depending on the version of Tableau you’re using you may need to toggle the meta data grid on to see it). Getting data into Tableau is as simple as that, if we just wanted to analyse the Q4 orders data we could go ahead and click Sheet1 at the bottom of the screen and start analysing the data.  It’s more likely that you’d have to bring in more data, or supplement your data so we’ll take a look at doing that next. 2. Union data from the same fileThe data that we’ve connected to so far shows us all our orders for the 4th quarter of the year (Q4), but we can also see on the left pane that there are sheets in our data for the first three quarters as well. We’d like to also bring this data in so we can see how we’ve been doing across the entire year. We can do this by “unioning” these sheets together. A union just means we’re going to add (or append) some data to the bottom of another sheet, as long as the sheets contain the same amount of columns and the data in each column is in a consistent format across the then we can union them together. A typical example of this might be when we want to add in data from previous time periods, or perhaps if we’re combining data from multiple regions, teams or business units.
Tableau has now added the Q3, Q2 and Q1 orders to your original data and If you scroll through the data grid now you should see that the table looks the same but it has data from all four quarters contained in it now. To see what Tableau has done, or if you want to edit the union, you can double click the Q4 Orders table on your canvas and the title at the top should show that it’s made up of 4 tables. If you then right click on the table and click Edit Union… you can see what the union you created is made up of. If you know at the start you want to union your data you can simply highlight each of the tables in the left pane (on windows click Q1 Orders, then hold the shift key and click Q4 Orders to select them all) and drag and drop them onto the canvas and Tableau will automatically union them for you. You can also manually create a union using the New Union option, we rarely use this but it can be useful if you want to use any of the more advanced options which we’ll take a look at now:
This now gives us the Union window that allows us to tell Tableau how we want to union our data. We’re going to use the Specific (manual) option but click on Wildcard (automatic) and we’ll take a quick look at what you can do in here.
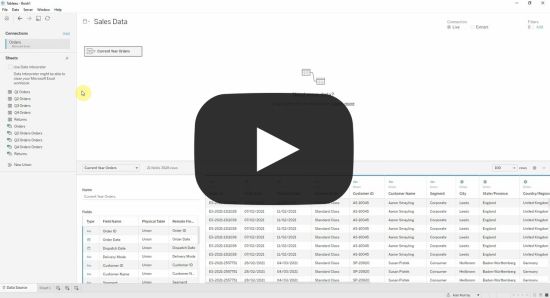
Notice that your table now says Union to indicate that it’s a union of your data? Let’s rename this to make it a bit clearer what it is for anyone that comes to use it in the future.
We’ve now got a table of data with all of our orders and sales fata from each quarter of the year.  Quite often you’ll want to supplement your data with data from the same source so we’ll take a look at that in the next step by adding in the returns data. 3. Join data from the same source (multiple Excel Sheets)In this step we’re going to add in our Returns data which is the final sheet in the Orders.xlsx file and will enable us to flag which orders were returned and decide if we want to keep them in the sales figures or not. If you take a look at the Returns sheet you’ll notice that this is essentially a list of order IDs, whereas before we added rows to the bottom of our data using a union this time we want to essentially add the order ID column from the Returns sheet to our Orders data so we can see if each order had a return associated with it. Combining data in this way is usually called a “Join” since you’re joining data together from two different sources. From version 2019.4 onwards Tableau introduced the concept of Data Relationships, these aren’t strictly the same as data joins however we use the term interchangeably in this course as they essentially do the same thing from a user perspective.
Lets go ahead and join (or relate!) our Returns data to our Current Year Orders data:
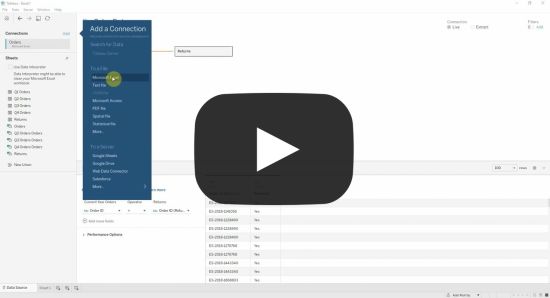
And that’s it done! Notice in the canvas that both tables still exists on their own, if you click on either you should see their respective data in the data grid when you click either of them. Rather than joining the two tables into one physical table Tableau has created a ‘relationship’ between the two tables and will only join the data when you start to use it and only if you bring on a field from both data sets.  We’ve now got all the data we need from our Orders file, next we’ll look at how we can add in data from different files. 4. Combine data from multiple MS Excel filesIt’s pretty common to not have all the data you need in one file and need to bring data in from a number of files, Tableau doesn’t restrict you to using just one file and you can easily bring in and join data from multiple data sources or files in exactly the same way as above. In this step we’re going to add our customer allocation and territory assignments data from our Sales Allocations.xlsx file. These will allow us to show which of our sales territories each of our customers, and therefore orders, are allocated too and then also see which sales people/teams each territory belongs to and allow us to do deeper analysis on our sales performance using this additional data. This is really useful as it allows our data to be much more flexible. Imagine if we decided to re-allocate some of our customers to different territories, or perhaps a sales person left and was replaced by someone else. If we had all this data sat in one sheet we’d have to get that sheet updated with the new data and then load it back in again, by relating our data we can just load in the sheet that has changed and automatically update all of our data. Let’s add in the new Sales Allocations.xlsx file and the sheets from within it:
We’ve now got much more data to use in our analysis, as well as our orders and returns we can now see which sales territories, teams and divisions each customer is allocated too and therefore start to analyse our sales data from that perspective.  In the next step we’ll look at how we can connect to and add data from different data sources including other files such as CSV, Text or JSON files as well as directly from databases and systems plus other advanced options such as importing from PDF files and APIs... Subscribe to Tableau Academy to read the rest.Become a paying subscriber of Tableau Academy to get access to this post and other subscriber-only content. A subscription gets you:
|
Older messages
🧹Course: Cleaning, preparing and transforming data with Tableau Prep
Monday, May 22, 2023
Up to now we've created solutions where the data has already been prepared for us, in this course we look at how we can clean, prepare and transform data to use in our analysis using Tableau Prep
Course: Creating a business Key Performance Indicator (KPI) dashboard
Tuesday, May 16, 2023
In the third Tableau Academy course you've been tasked with creating a KPI dashboard to align the strategic goals and aims within your organisation and reduce the number of reports and KPIs.
Course: Creating an interactive sales dashboard in Tableau
Friday, May 12, 2023
In this Tableau Academy course you take up the role of a sales operations analyst who has been tasked with creating an interactive global sales dashboard for the retail chain they work for.
Tableau Tea Break, Tableau Jobs & Tableau Academy are now one!
Wednesday, April 26, 2023
Back for 2023! We're pleased to announce Tableau Tea Break, Tableau Jobs and Tableau Academy are all back and now under one banner, read on to find out more!
Your Complete Tableau Learning Pathway
Friday, February 17, 2023
Go from complete Tableau newbie to Tableau master in no time by following our tried and tested Tableau Learning Pathway. Simply follow each of the courses below in your own time and you'll cover
You Might Also Like
Instagram Book Promotion for Authors and Publishers
Friday, February 28, 2025
Your book on Instagram! Instagram promo image Instagram ~ a great place to advertise books
🤯 This is what calling your shot looks like…
Thursday, February 27, 2025
This year, we're playing to win. Read our annual company update right here, right now. Learn about our biggest moves yet... Playing to Win Contrarians, First, thank you. Trust is a rare currency in
3-2-1: On the secret to self-control, how to live longer, and what holds people back
Thursday, February 27, 2025
“The most wisdom per word of any newsletter on the web.” 3-2-1: On the secret to self-control, how to live longer, and what holds people back read on JAMESCLEAR.COM | FEBRUARY 27, 2025 Happy 3-2-1
10 Predictions for the 2020s: Midterm report card
Thursday, February 27, 2025
In December of 2019, which feels like quite a lifetime ago, I posted ten predictions about themes I thought would be important in the 2020s. In the immediate weeks after I wrote this post, it started
Ahrefs’ Digest #220: Hidden dangers of programmatic SEO, Anthropic’s SEO strategy, and more
Thursday, February 27, 2025
Welcome to a new edition of the Ahrefs' Digest. Here's our meme of the week: — Quick search marketing news Google Business Profile now explains why your verification fails. Google launches a
58% of B2B Buyers Won't Consider You.
Thursday, February 27, 2025
Here's why, and how to fix it. ͏ ͏ ͏ ͏ ͏ ͏ ͏ ͏ ͏ ͏ ͏ ͏ ͏ ͏ ͏ ͏ ͏ ͏ ͏ ͏ ͏ ͏ ͏ ͏ ͏ ͏ ͏ ͏ ͏ ͏ ͏ ͏ ͏ ͏ ͏ ͏ ͏ ͏ ͏ ͏ ͏ ͏ ͏ ͏ ͏ ͏ ͏ ͏ ͏ ͏ ͏ ͏ ͏ ͏ ͏ ͏ ͏ ͏ ͏ ͏ ͏ ͏ ͏ ͏ ͏ ͏ ͏ ͏ ͏ ͏ ͏ ͏ ͏ ͏ ͏ ͏ ͏ ͏ ͏ ͏ ͏ ͏ ͏
Teleportation, AI Innovation, and Outgrowing 'Good Enough'
Thursday, February 27, 2025
Oxford scientists have achieved quantum teleportation of logic gates, AI advances include France's €109B investment, Unitree's eerily smooth robotic movements, and DeepMind's Veo2 video
🧙♂️ Quick question
Thursday, February 27, 2025
Virtual dry-run of my event ͏ ͏ ͏ ͏ ͏ ͏ ͏ ͏ ͏ ͏ ͏ ͏ ͏ ͏ ͏ ͏ ͏ ͏ ͏ ͏ ͏ ͏ ͏ ͏ ͏ ͏ ͏ ͏ ͏ ͏ ͏ ͏ ͏ ͏ ͏ ͏ ͏ ͏ ͏ ͏ ͏ ͏ ͏ ͏ ͏ ͏ ͏ ͏ ͏ ͏ ͏ ͏ ͏ ͏ ͏ ͏ ͏ ͏ ͏ ͏ ͏ ͏ ͏ ͏ ͏ ͏ ͏ ͏ ͏ ͏ ͏ ͏ ͏ ͏ ͏ ͏ ͏ ͏ ͏ ͏ ͏ ͏ ͏ ͏ ͏ ͏ ͏
A Classical Way to Save the Whales
Thursday, February 27, 2025
But what song, we don't know.
I'm investing in early stage AI startups
Thursday, February 27, 2025
Hi all, I'm investing in early stage AI startups. If you know someone who's looking for easy-to-fit-in checks from helpful founders (happy to provide references) I'd love to chat. Trevor
