Coin Metrics’ State of the Network: Issue 223
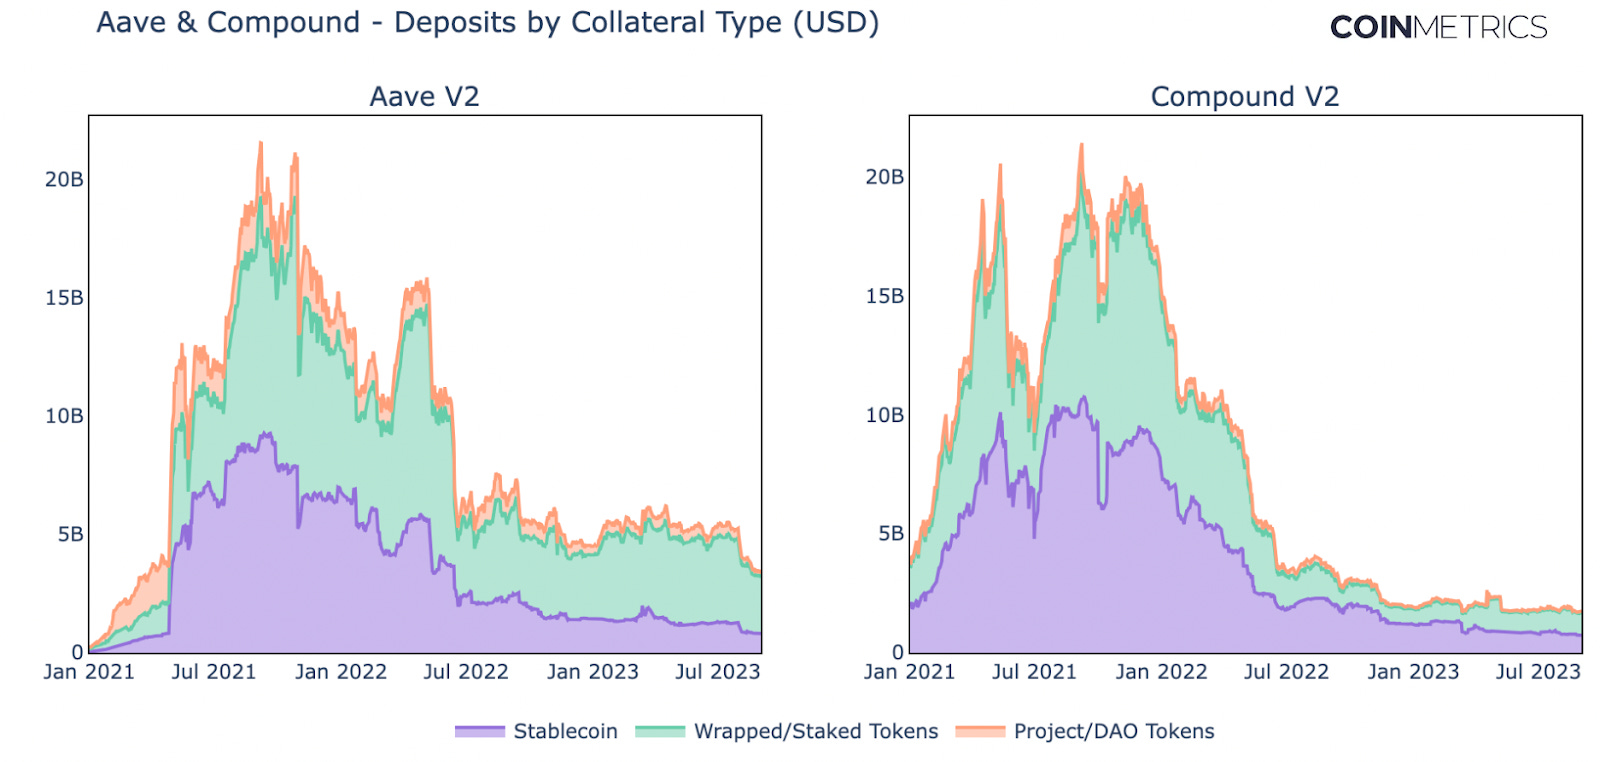
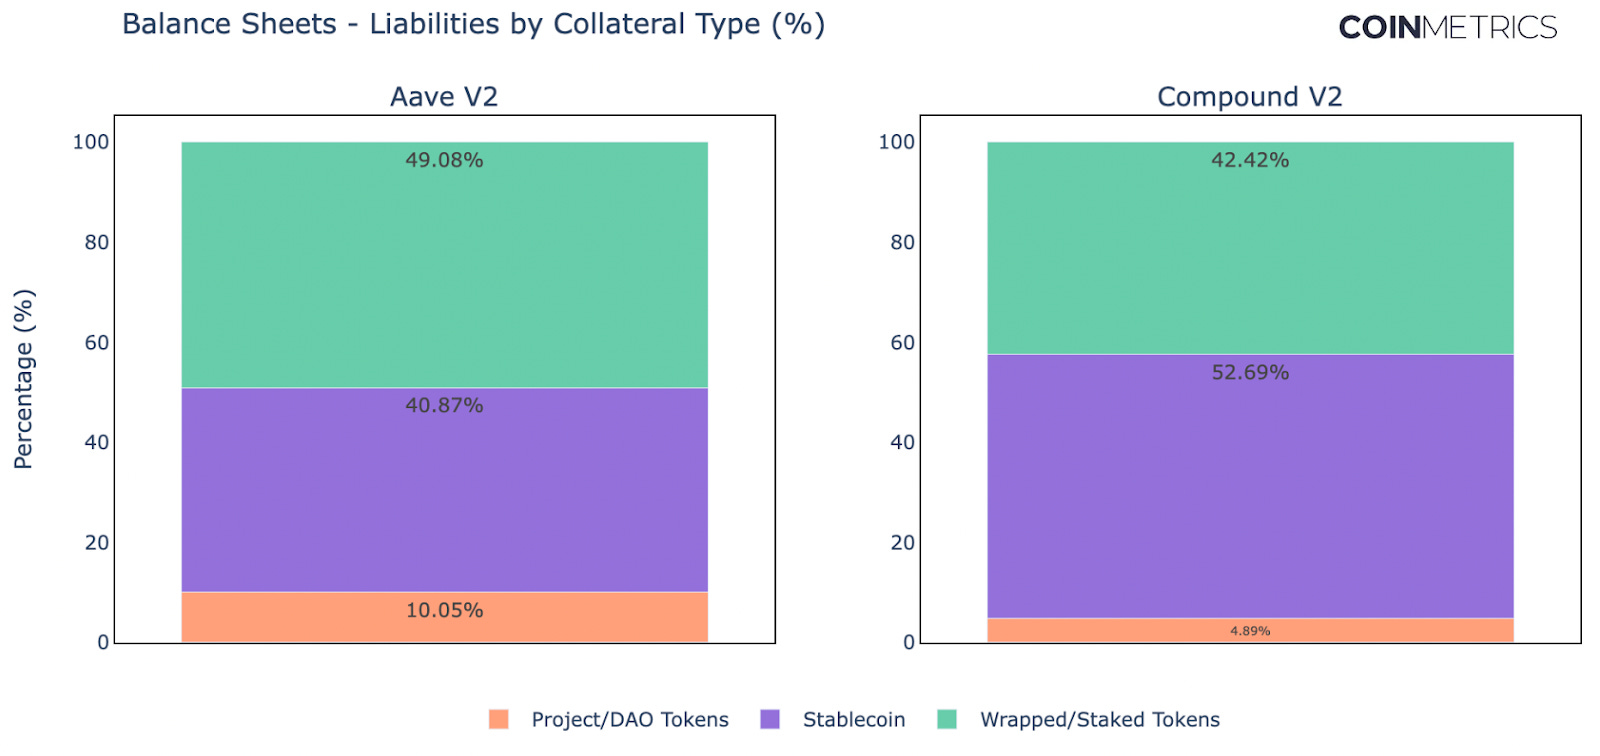
Get the best data-driven crypto insights and analysis every week: Evaluating the Market Quality of DeFi CollateralBy: Tanay Ved & Matías Andrade Cabieses Lending’s roots date back to 3000–2000 BC in ancient Mesopotamia, when the capital-intensive nature of agricultural society (and a religious elite hungry for rich and diverse harvest) inspired the need for loans, often collateralized with cattle, agricultural implements, and precious metals. Although financial instruments have significantly evolved and diverged from these early forms, these practices persist as fundamental pillars of global economic expansion. These origins underscore the enduring significance of collateral as a risk pivot, safeguarding lenders against borrower defaults. The 2008 financial crisis—exacerbated by subprime mortgages backing collateralized debt obligations (CDO’s)—infamously evidences the imperative of meticulous collateral assessment for a robust and resilient financial system. In today's financial markets, common forms of collateral range from real estate and capital assets like machinery, to financial securities like equities and treasuries or corporate bonds. Each asset class carries a distinct risk profile, significantly influencing the structuring of loan agreements, including interest rates and Loan-to-Value (LTV) ratios. Technological advancements have extended the venerable institution of lending onto public blockchains such as Ethereum, where digital assets serve as primary forms of collateral. While decentralized finance (DeFi) lending applications like Aave and Compound have unlocked significant benefits and efficiencies, they also introduce unique risk vectors, as elaborated in our recent report DeFi's Double-Edged Sword. Nevertheless, the transparent nature of public blockchains has enabled continuous, real-time monitoring of DeFi protocol balance sheets, affording a unique advantage in due diligence. In this issue of State of the Network, we use a combination of Coin Metrics’ Network Data (DeFi Balance Sheets) and Market Data to assess predominant forms of collateral in DeFi, examining their unique risk characteristics to understand what makes collateral more or less desirable. Within peer-to-pool systems such as Aave and Compound, capital supplied by lenders is aggregated into liquidity pools, embodied by smart contracts. Borrowers engage with these pools by providing collateral to secure loans. To safeguard against defaults, these protocols stipulate overcollateralization, guaranteeing that the collateral value exceeds the value of debt. This setup offers an additional layer of security to lenders, even during volatile market conditions. Since the instantiation of these protocols, the total value of deposits has increased to around $20B at their peak in 2021. However, along with prevailing global macroeconomic conditions and an overall slump in digital asset markets, deposits on Aave and Compound have fallen to $3.3B and $1.6B respectively, as participants seek higher yields from less risky securities, such as US Treasuries. Despite this ebb in activity, we can take this moment to evaluate the use of collateral across these protocols throughout the bull/bear cycle. The chart above shows the breakdown of liabilities (deposits) for the Aave and Compound protocols as of August 30th. Among digital assets used as collateral, three primary categories emerge: Stablecoins, Wrapped/Staked assets and Project/Decentralized Autonomous Organization (DAO) tokens. These asset types vary in purpose and characteristics, akin to traditional forms of collateral like cash and securities as compared to illiquid assets like real-estate.
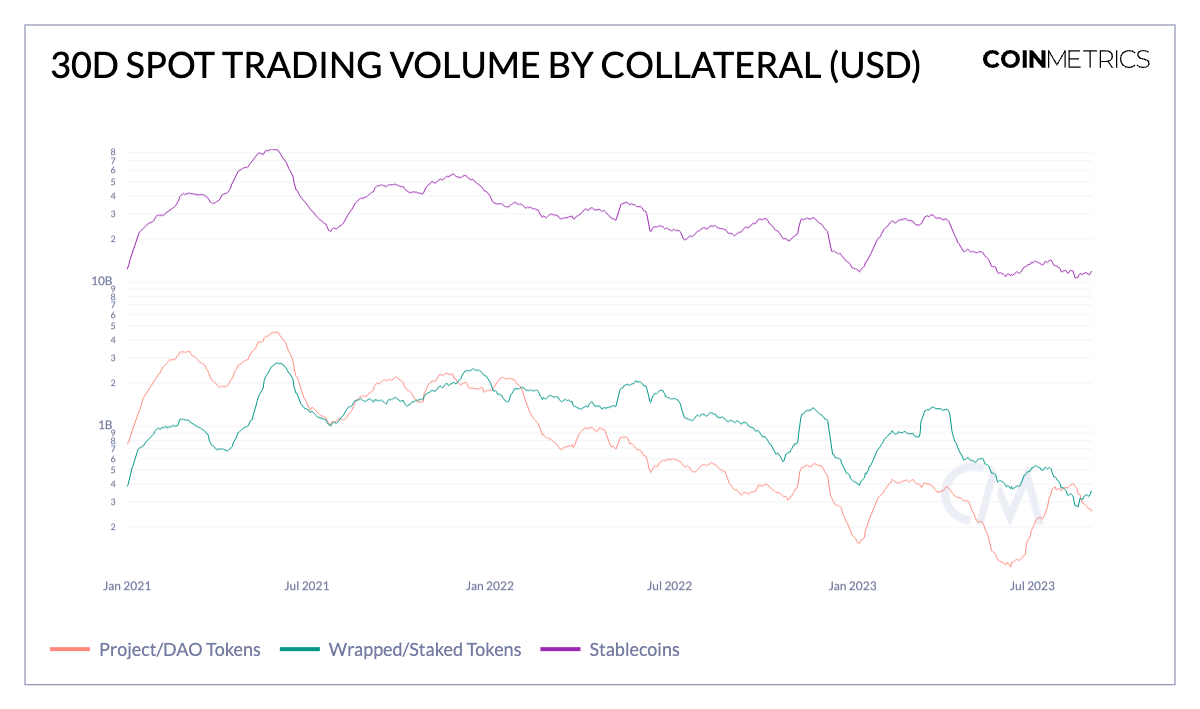
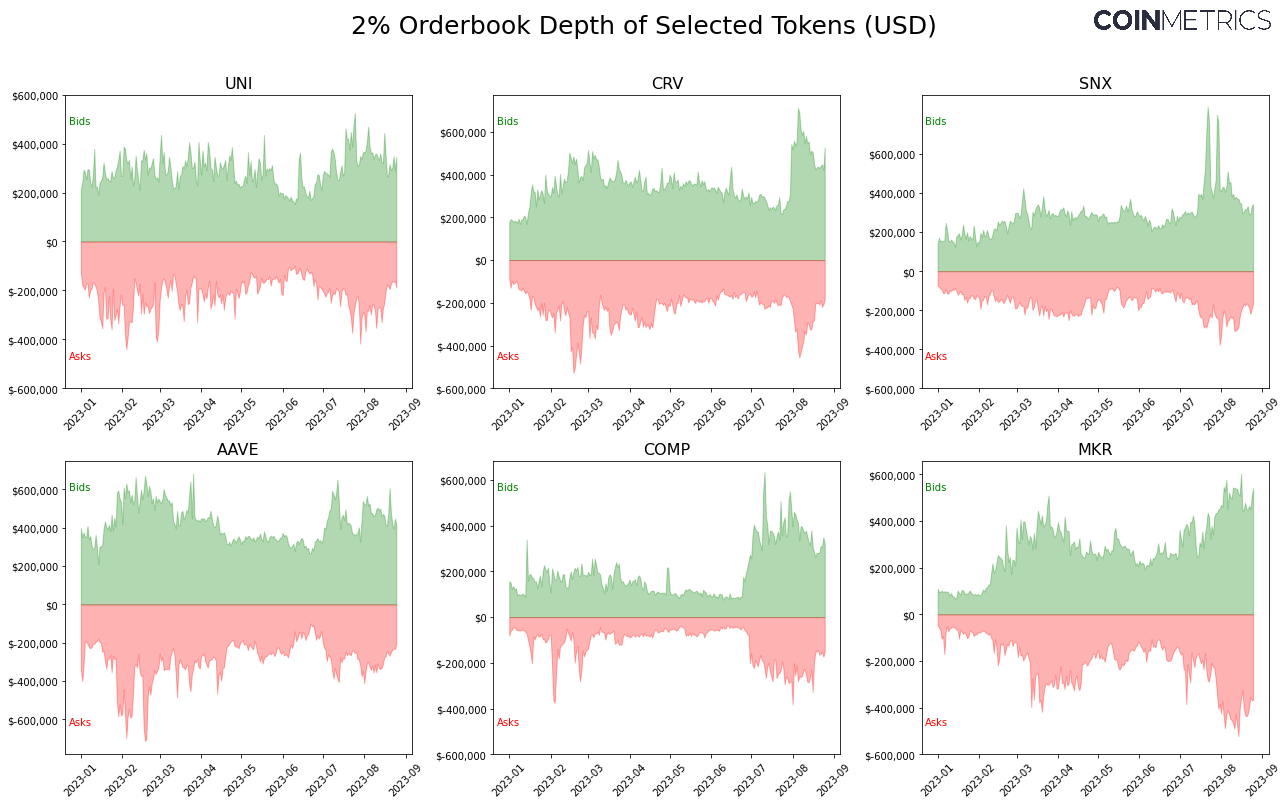
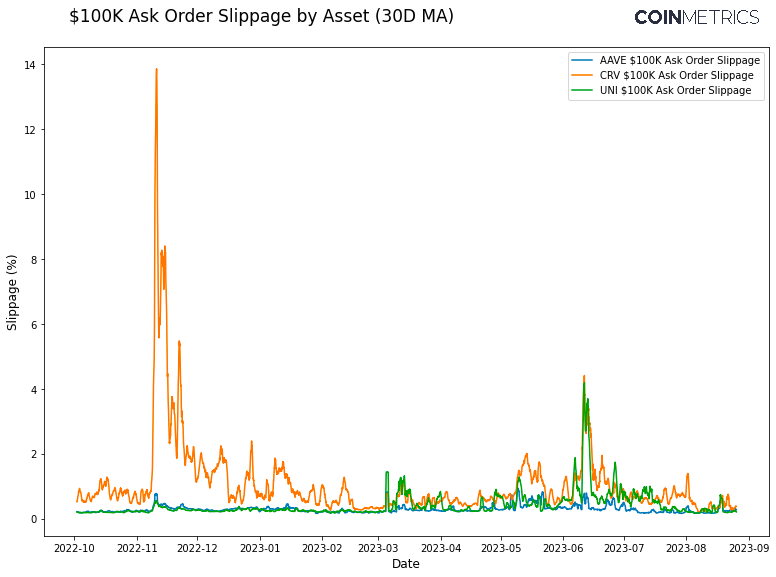
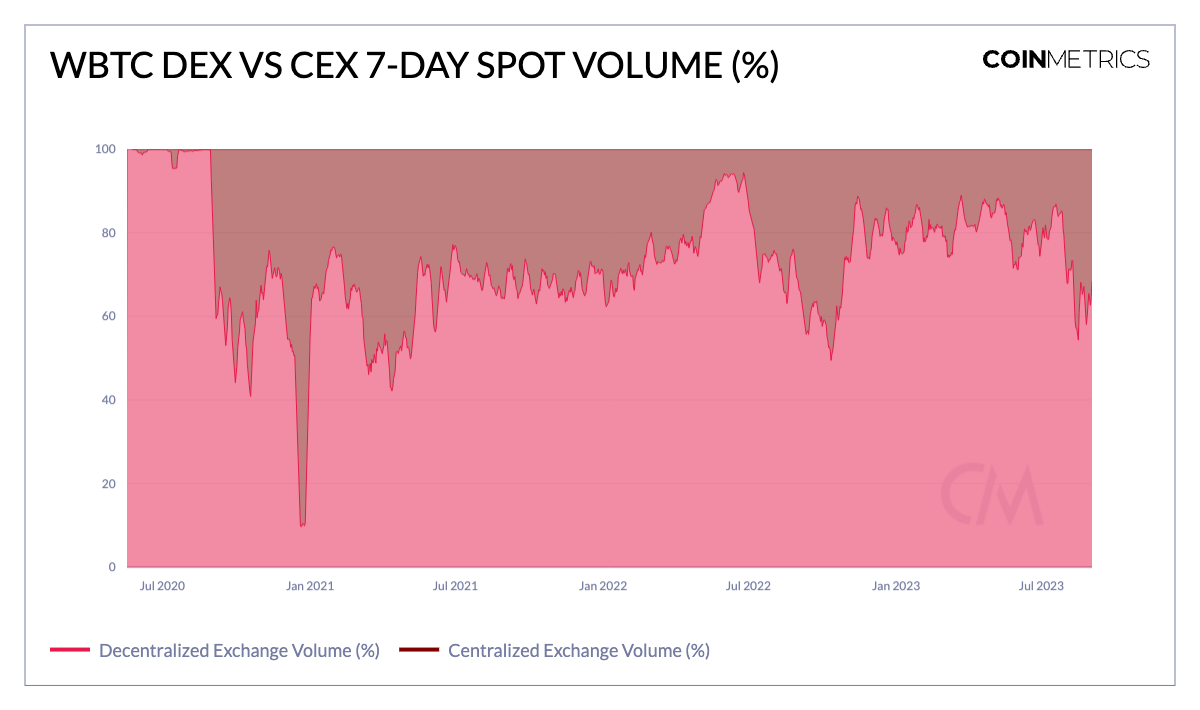
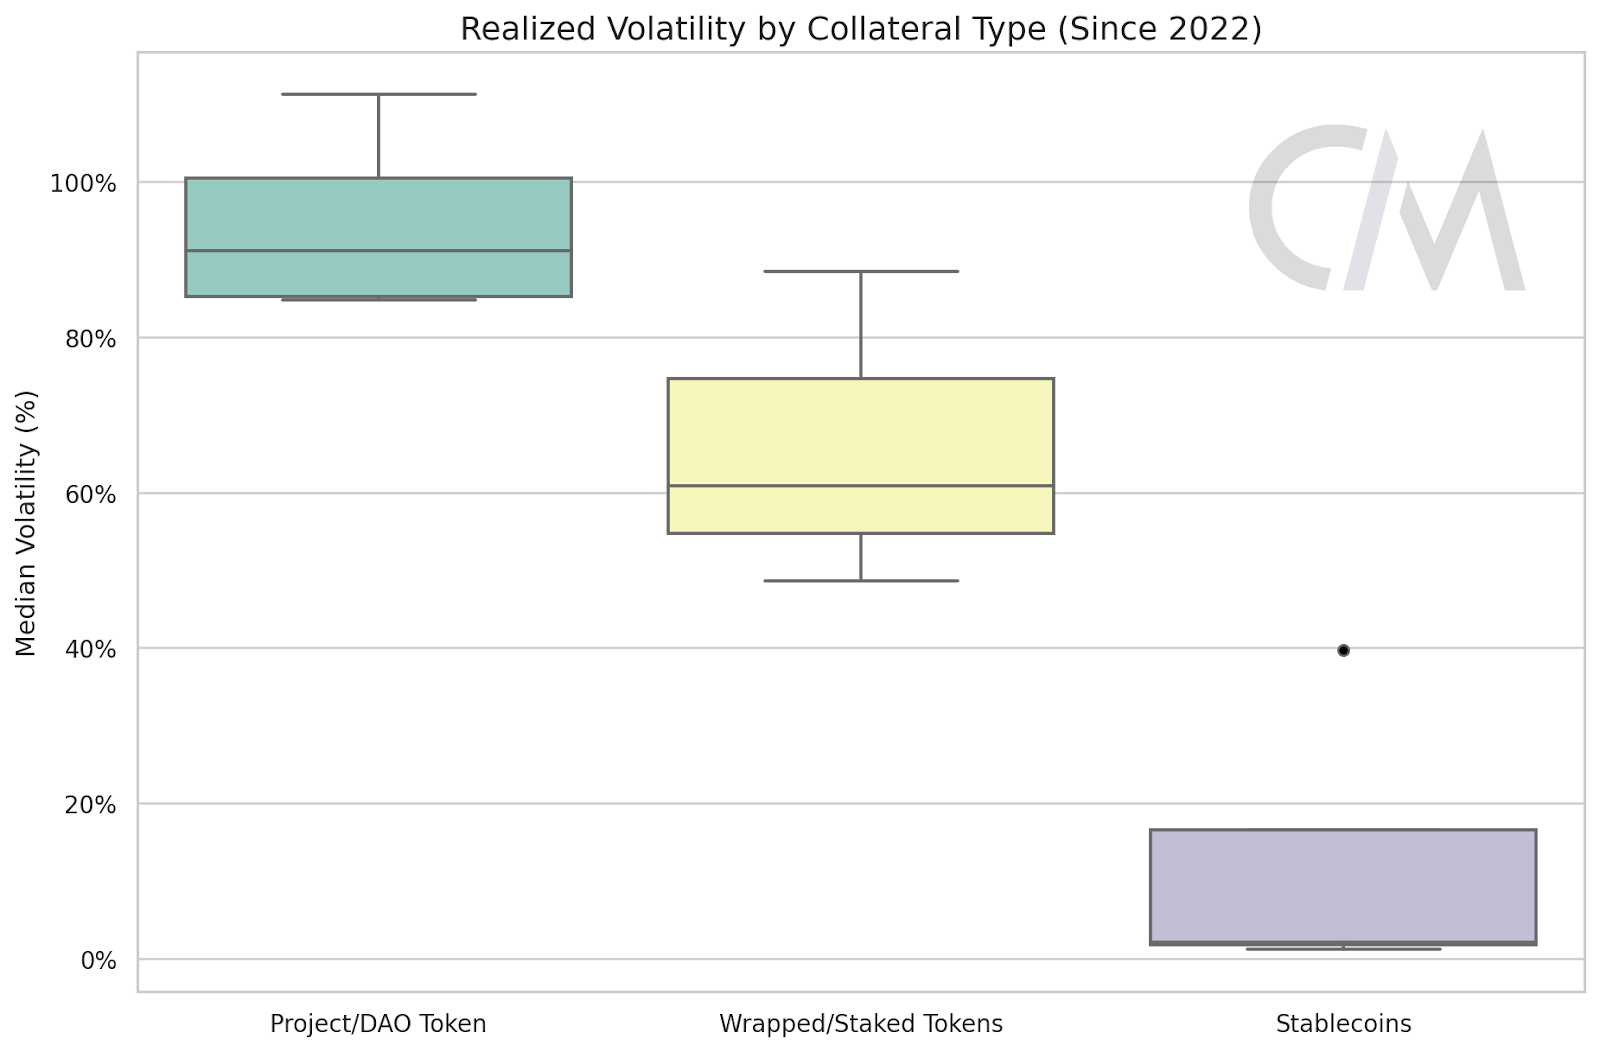
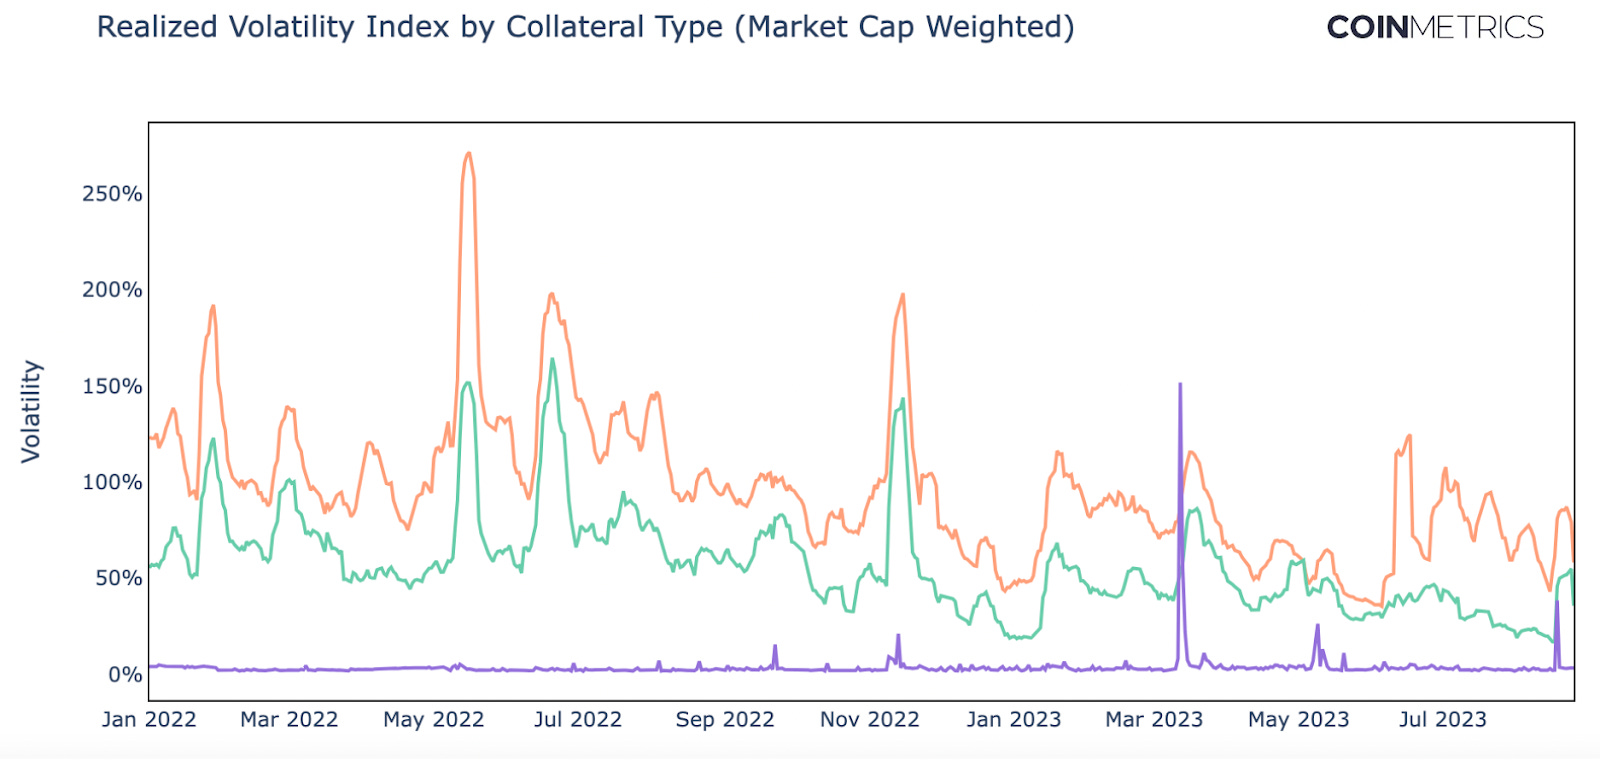
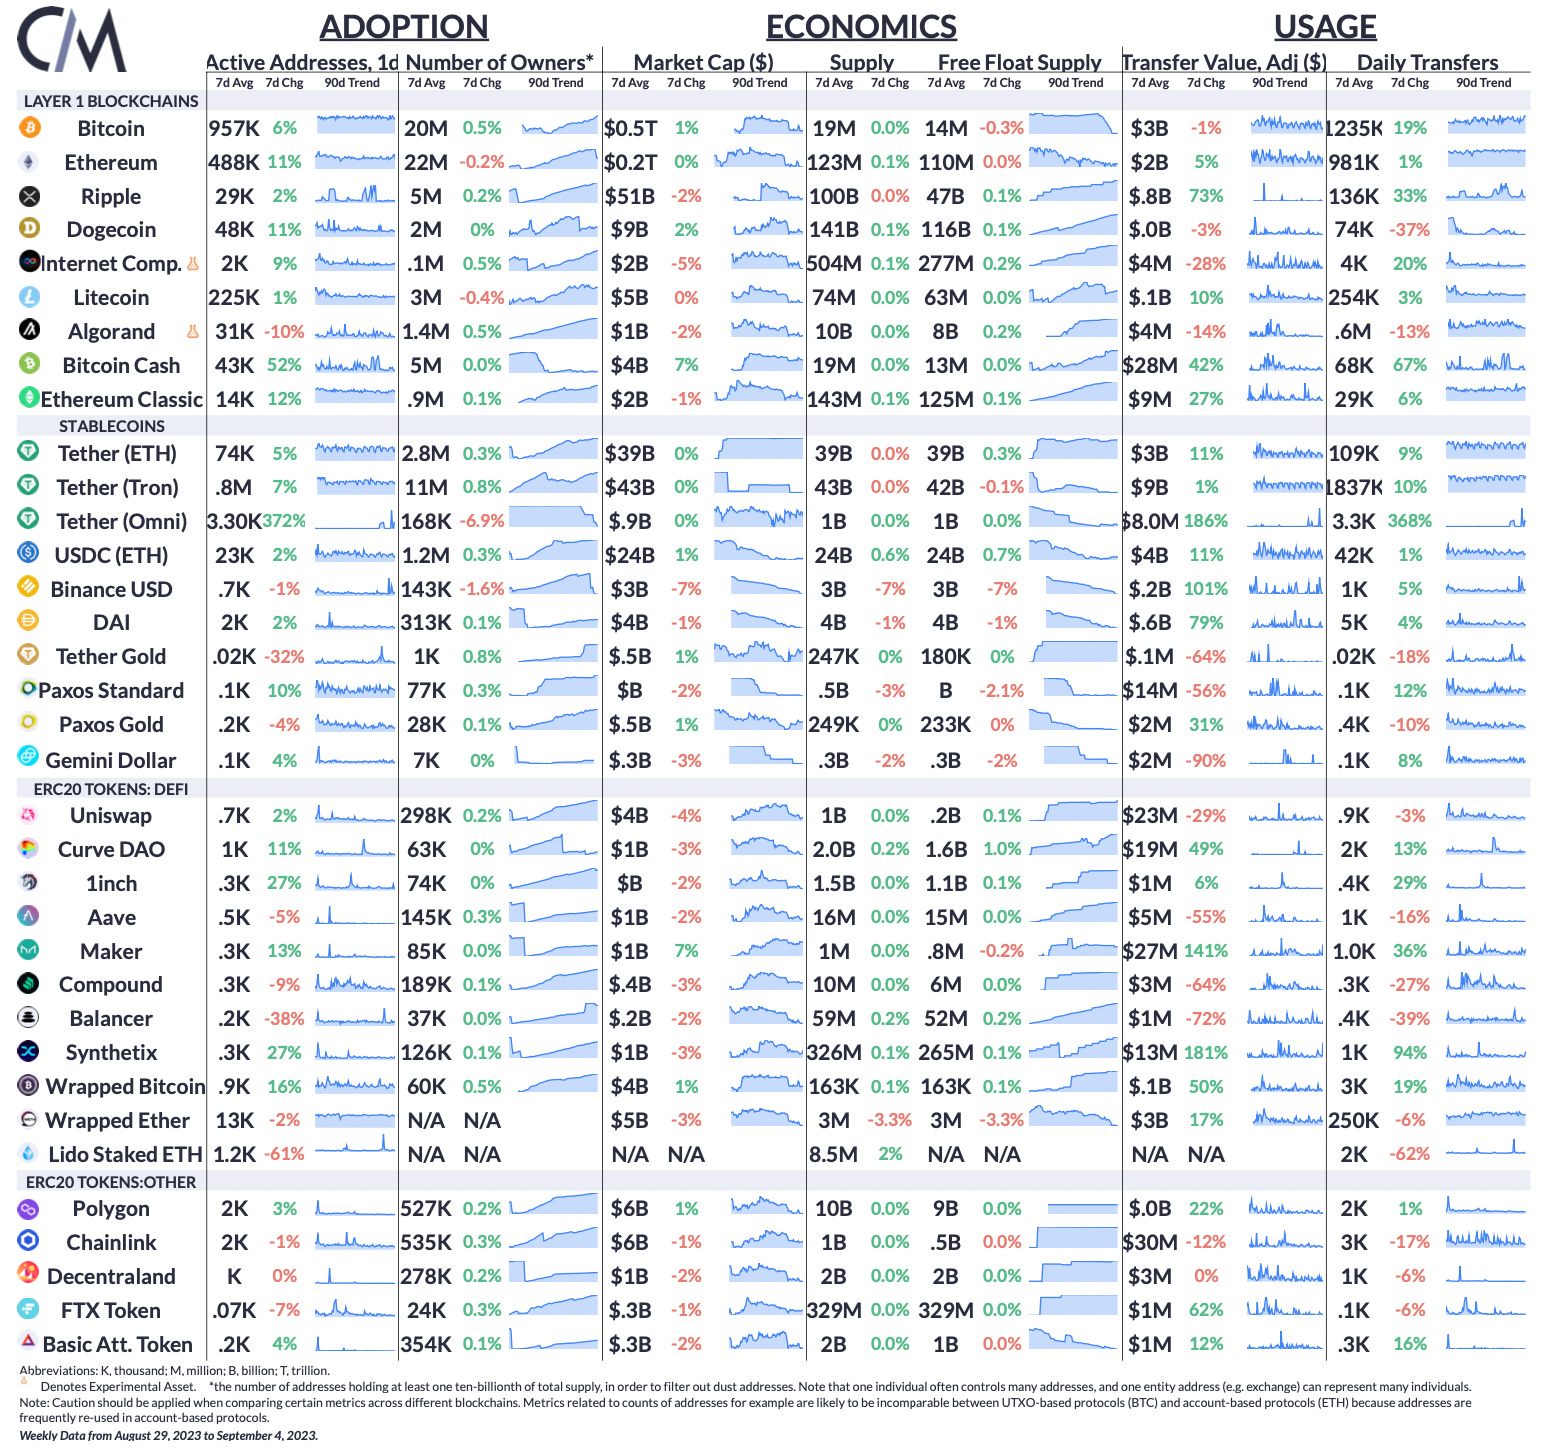
Another category of collateral that is increasingly gaining utilization is real-world assets (RWA). RWAs include the representation of physical and traditional financial assets on the blockchain. MakerDAO is an example of a DeFi protocol with a collateral base increasingly composed of RWAs, such as US Treasuries. Some critical elements that help ensure protocol solvency are parameters such as Loan-to-Value ratios (the amount that can be borrowed against deposited collateral), and liquidation thresholds (which signal under-collateralized positions). Although at outset influenced by factors like liquidity and volatility, they are typically adjusted through governance proposals, which means they may be slow to adapt to external market conditions after issuance of a loan. In the following sections, we will assess the liquidity and volatility characteristics of each collateral type to gauge their desirability on the collateral spectrum. To effectively manage credit and manipulation risks, DeFi protocols must take into account liquidity indicators and prevailing liquidity conditions that exist both on-chain and off-chain. Trading volumes are an important market factor to consider when determining collateral quality, as it indicates how actively traded is an asset, serving as a proxy for liquidity. The aggregated 30-day spot trading volume by collateral type showcases stablecoin dominance in trading activity. Currently about $11.5B (> 90%) of trading volume is in stablecoins, as compared to $345M for wrapped/staked assets and project/DAO tokens. Stablecoins, particularly Tether (USDT), are often employed as quote assets on centralized exchanges against other crypto assets—contributing to higher volumes. Source: Coin Metrics Formula Builder Going a step further, we can get a more granular view of an assets liquidity profile by looking at market depth. The chart below displays the order book depth of selected DAO tokens within 2% of the mid-market price in USD across major centralized exchanges, including Binance and Coinbase. In other words, it showcases how much of the asset needs to be bought or sold to move the market price by 2%. Given the low market depth observed, it's clear that governance tokens are relatively illiquid with only about $400k in bid depth required to cause significant market impact. Thin liquidity observed amongst these tokens can also translate to increased slippage. Slippage occurs when there’s a difference between the expected price and actual price for a bid/ask order. This is particularly important in the context of liquidations on lending protocols. Heightened market volatility can cause users’ positions to become under-collateralized, thereby triggering a liquidation where liquidators sell the collateral asset to repay the debt. As seen below, there have been cases when slippage experienced on a $100k sell order is very high for tokens like CRV and UNI. As seen in November 2022 when CRV collateral on Aave was in focus due to an attempted exploit, slippage on CRV ask orders was at 14%—greatly impacting profitability for liquidators and threatening solvency. This is why overcollateralization is so important. DeFi protocol parameters such as Loan-to-Value ratios, liquidation thresholds and bonuses—typically adjusted manually via governance—can factor in this data to adapt dynamically to changing liquidity conditions. This can protect lenders and the protocol itself from incurring bad debt. Along with liquidity indicators it's also crucial to consider the venues where these assets are primarily traded. Assets like wrapped Ether (WETH), wrapped Bitcoin (WBTC) and staked Ether (stETH) are mostly on-chain native, with a large presence on decentralized exchanges. Currently, 68% of WBTC trading volume is on decentralized exchanges (DEX’s) like Uniswap & Sushiswap—a feature that has prevailed through most of its history. Additionally, WETH also has a dominant presence on DEX’s as seen here. Source: Coin Metrics Formula Builder Most of staked Ether (stETH) liquidity is found in Curve Finance's ETH-stETH pool. Although the token has a strong secondary market, notably as the top-deposited token on Aave V2 ($1.1B in deposits), its on-chain liquidity appears to be deteriorating while its presence on centralized exchanges is relatively increasing. Stablecoins such as USDC and DAI also have a large on-chain presence due to their utility as collateral and as a quote asset for trading pairs on decentralized exchanges. The Curve 3Pool has been a major source of liquidity for these Stablecoins historically. Volatility Characteristics Understanding the volatility of collateral is also a crucial factor as it directly impacts credit risk. Fluctuations in the value of collateral increases the risk of under-collateralization and likelihood of liquidations, incurring additional costs for both borrowers and depositors while also potentially affecting the wider ecosystem. To understand the distinct volatility characteristics, we can explore the realized volatility distribution of constituent assets widely used as collateral. Stablecoins exhibit the lowest volatility, reflecting their design to maintain stable value outside of outliers like Frax and TUSD. On the other end of the spectrum, median volatility for DAO tokens lies at 90%, indicative of greater price sensitivity. Furthermore, a realized volatility index (weighted by market capitalization) provides a standardized measure of volatility over time, validating our findings from the distribution above. Despite variations in magnitude, volatility among collateral assets tends to be highly correlated across time. This raises important considerations for risk management and portfolio diversification, since assumptions that volatility and liquidity across assets and asset classes are independently distributed appears not to hold true. Implications for liquidations are also worth considering, as collateral being liquidated can in turn affect correlated assets, potentially leading to cascading liquidations and impoverished liquidity across the board. ConclusionThis analysis showcases the distinct characteristics and risk profiles of collateral used in DeFi lending protocols. As portrayed through factors like trading volume, liquidity and price volatility, it is evident that these assets types differ widely on the spectrum of desirability as collateral. Therefore, it’s important for stakeholders and users of DeFi protocols to be mindful of the collateral utilized and their related characteristics. Interestingly, despite the real-time data available to DeFi protocols, most loan parameters to-date rely on data set with large delay. In other words, today once a LTV is set for a loan, it is encoded on-chain for the life of the position. Future iterations of DeFi protocols might benefit from dynamically adjusting these parameters in response to changing market conditions. Furthermore, an analysis of the ownership concentration, supply dynamics and nuances of DAO based governance are also significant factors to consider which we hope to cover in future editions. However, it's clear that effective risk management in DeFi requires a holistic understanding of external market conditions, thereby impacting the ability to dynamically adapt to constantly changing market conditions. Network Data Summary MetricsSource: Coin Metrics Network Data Pro Ethereum active addresses rose 11% week over week to 488k per day. Bitcoin daily active addresses also rose 6%. MKR transfer value rose 141% week over week, after MakerDAO founder Rune Christiansen proposed a reimplementation of the Maker protocol on “NewChain”, a fork of Solana. This would mark a significant change for one of the oldest DeFi projects on Ethereum. Ethereum co-founder Vitalik Buterin was quick to react, selling half a million dollars worth of MKR and suggesting “MakerDAO is torpedoing itself in weird directions.” This week’s updates from the Coin Metrics team:
As always, if you have any feedback or requests please let us know here. Subscribe and Past IssuesCoin Metrics’ State of the Network, is an unbiased, weekly view of the crypto market informed by our own network (on-chain) and market data. If you'd like to get State of the Network in your inbox, please subscribe here. You can see previous issues of State of the Network here. © 2023 Coin Metrics Inc. All rights reserved. Redistribution is not permitted without consent. This newsletter does not constitute investment advice and is for informational purposes only and you should not make an investment decision on the basis of this information. The newsletter is provided “as is” and Coin Metrics will not be liable for any loss or damage resulting from information obtained from the newsletter. |
Older messages
Coin Metrics’ State of the Network: Issue 222
Tuesday, August 29, 2023
Coin Convergence: Piecing Together Common Ownership Patterns Across Major Stablecoins
Coin Metrics’ State of the Network: Issue 221
Tuesday, August 22, 2023
Beauty in Predictability: Understanding Bitcoin's Halving Cycle
Coin Metrics’ State of the Network: Issue 220
Tuesday, August 15, 2023
From East to West: the Global Pulse of Stablecoin Transactions
Coin Metrics’ State of the Network: Issue 219
Tuesday, August 8, 2023
DeFi's Double-Edged Sword
Coin Metrics’ State of the Network: Issue 218
Tuesday, August 1, 2023
Decoding the Digital Dollar: Unraveling the Risks of Stablecoins
You Might Also Like
Central African Republic’s CAR memecoin raises scrutiny
Friday, February 14, 2025
Allegations of deepfake videos and opaque token distribution cast doubts on CAR's ambitious memecoin project. ͏ ͏ ͏ ͏ ͏ ͏ ͏ ͏ ͏ ͏ ͏ ͏ ͏ ͏ ͏ ͏ ͏ ͏ ͏ ͏ ͏ ͏ ͏ ͏ ͏ ͏ ͏ ͏ ͏ ͏ ͏ ͏ ͏ ͏ ͏ ͏ ͏ ͏ ͏ ͏ ͏ ͏ ͏ ͏
January CEX Data Report: Significant Declines in Trading Volume Across Major CEXs, Spot Down 25%, Derivatives Down…
Friday, February 14, 2025
According to data collected by the WuBlockchain team, spot trading volume on major central exchanges in January 2025 decreased by 25% compared to December 2024. ͏ ͏ ͏ ͏ ͏ ͏ ͏ ͏ ͏ ͏ ͏ ͏ ͏ ͏ ͏ ͏ ͏ ͏ ͏ ͏
Previewing Coinbase Q4 2024 Earnings
Friday, February 14, 2025
Estimating Coinbase's Transaction and Subscriptions & Services Revenue in Q4 2024 ͏ ͏ ͏ ͏ ͏ ͏ ͏ ͏ ͏ ͏ ͏ ͏ ͏ ͏ ͏ ͏ ͏ ͏ ͏ ͏ ͏ ͏ ͏ ͏ ͏ ͏ ͏ ͏ ͏ ͏ ͏ ͏ ͏ ͏ ͏ ͏ ͏ ͏ ͏ ͏ ͏ ͏ ͏ ͏ ͏ ͏ ͏ ͏ ͏ ͏ ͏ ͏ ͏ ͏ ͏ ͏
ADA outperforms Bitcoin as Grayscale seeks approval for first US Cardano ETF in SEC filing
Friday, February 14, 2025
Grayscale's Cardano ETF filing could reshape ADA's market position amid regulatory uncertainty ͏ ͏ ͏ ͏ ͏ ͏ ͏ ͏ ͏ ͏ ͏ ͏ ͏ ͏ ͏ ͏ ͏ ͏ ͏ ͏ ͏ ͏ ͏ ͏ ͏ ͏ ͏ ͏ ͏ ͏ ͏ ͏ ͏ ͏ ͏ ͏ ͏ ͏ ͏ ͏ ͏ ͏ ͏ ͏ ͏ ͏ ͏ ͏ ͏
AI project trading tips: investment targets and position management
Friday, February 14, 2025
This interview delves into the investment trends, market landscape, and future opportunities within AI Agent projects. ͏ ͏ ͏ ͏ ͏ ͏ ͏ ͏ ͏ ͏ ͏ ͏ ͏ ͏ ͏ ͏ ͏ ͏ ͏ ͏ ͏ ͏ ͏ ͏ ͏ ͏ ͏ ͏ ͏ ͏ ͏ ͏ ͏ ͏ ͏ ͏ ͏ ͏ ͏ ͏ ͏
DeFi & L1L2 Weekly — 📈 Polymarket recorded a new high of 462.6k active users in Jan despite volume dip; Holesky a…
Friday, February 14, 2025
Polymarket recorded a new high of 462600 active users in January despite volume dip; Holesky and Sepolia testnets are scheduled to fork in Feb and Mar for Ethereum's Pectra upgrade. ͏ ͏ ͏ ͏ ͏ ͏ ͏ ͏
Donald Trump taps crypto advocate a16z’s Brian Quintenz for CFTC leadership
Friday, February 14, 2025
Industry leaders back Brian Quintenz's nomination, highlighting his past efforts at the CFTC and potential to revamp crypto oversight. ͏ ͏ ͏ ͏ ͏ ͏ ͏ ͏ ͏ ͏ ͏ ͏ ͏ ͏ ͏ ͏ ͏ ͏ ͏ ͏ ͏ ͏ ͏ ͏ ͏ ͏ ͏ ͏ ͏ ͏ ͏
⚡10 Tips to Make a Living Selling Info Products
Friday, February 14, 2025
PLUS: the best links, events, and jokes of the week → ͏ ͏ ͏ ͏ ͏ ͏ ͏ ͏ ͏ ͏ ͏ ͏ ͏ ͏ ͏ ͏ ͏ ͏ ͏ ͏ ͏ ͏ ͏ ͏ ͏ ͏ ͏ ͏ ͏ ͏ ͏ ͏ ͏ ͏ ͏ ͏ ͏ ͏ ͏ ͏ ͏ ͏ ͏ ͏ ͏ ͏ ͏ ͏ ͏ ͏ ͏ ͏ ͏ ͏ ͏ ͏ ͏ ͏ ͏ ͏ ͏ ͏ ͏ ͏ ͏ ͏ ͏ ͏ ͏ ͏ ͏ ͏ ͏ ͏
Interview with CryptoD: How He Made $17 Million Profit on TRUMP Coin
Friday, February 14, 2025
Author | WUblockchain, Foresight News ͏ ͏ ͏ ͏ ͏ ͏ ͏ ͏ ͏ ͏ ͏ ͏ ͏ ͏ ͏ ͏ ͏ ͏ ͏ ͏ ͏ ͏ ͏ ͏ ͏ ͏ ͏ ͏ ͏ ͏ ͏ ͏ ͏ ͏ ͏ ͏ ͏ ͏ ͏ ͏ ͏ ͏ ͏ ͏ ͏ ͏ ͏ ͏ ͏ ͏ ͏ ͏ ͏ ͏ ͏ ͏ ͏ ͏ ͏ ͏ ͏ ͏ ͏ ͏ ͏ ͏ ͏ ͏ ͏ ͏ ͏ ͏ ͏ ͏ ͏ ͏ ͏ ͏ ͏ ͏ ͏ ͏

