Coin Metrics' State of the Network: Issue 180
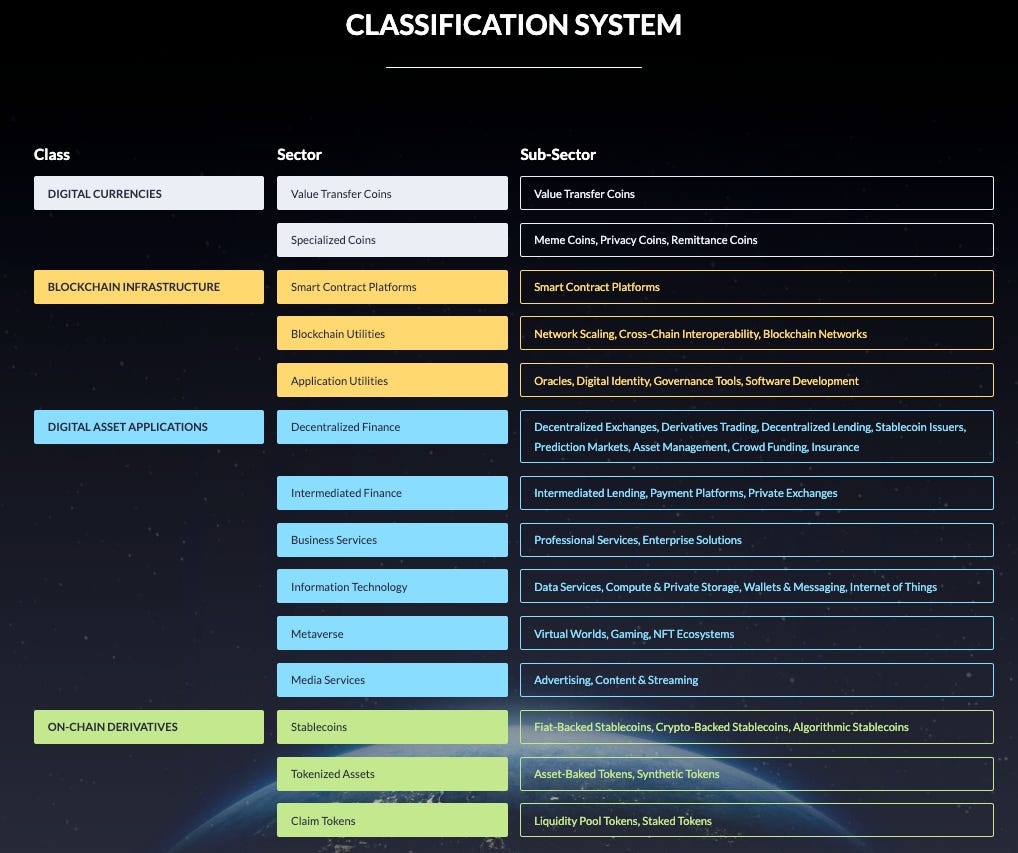
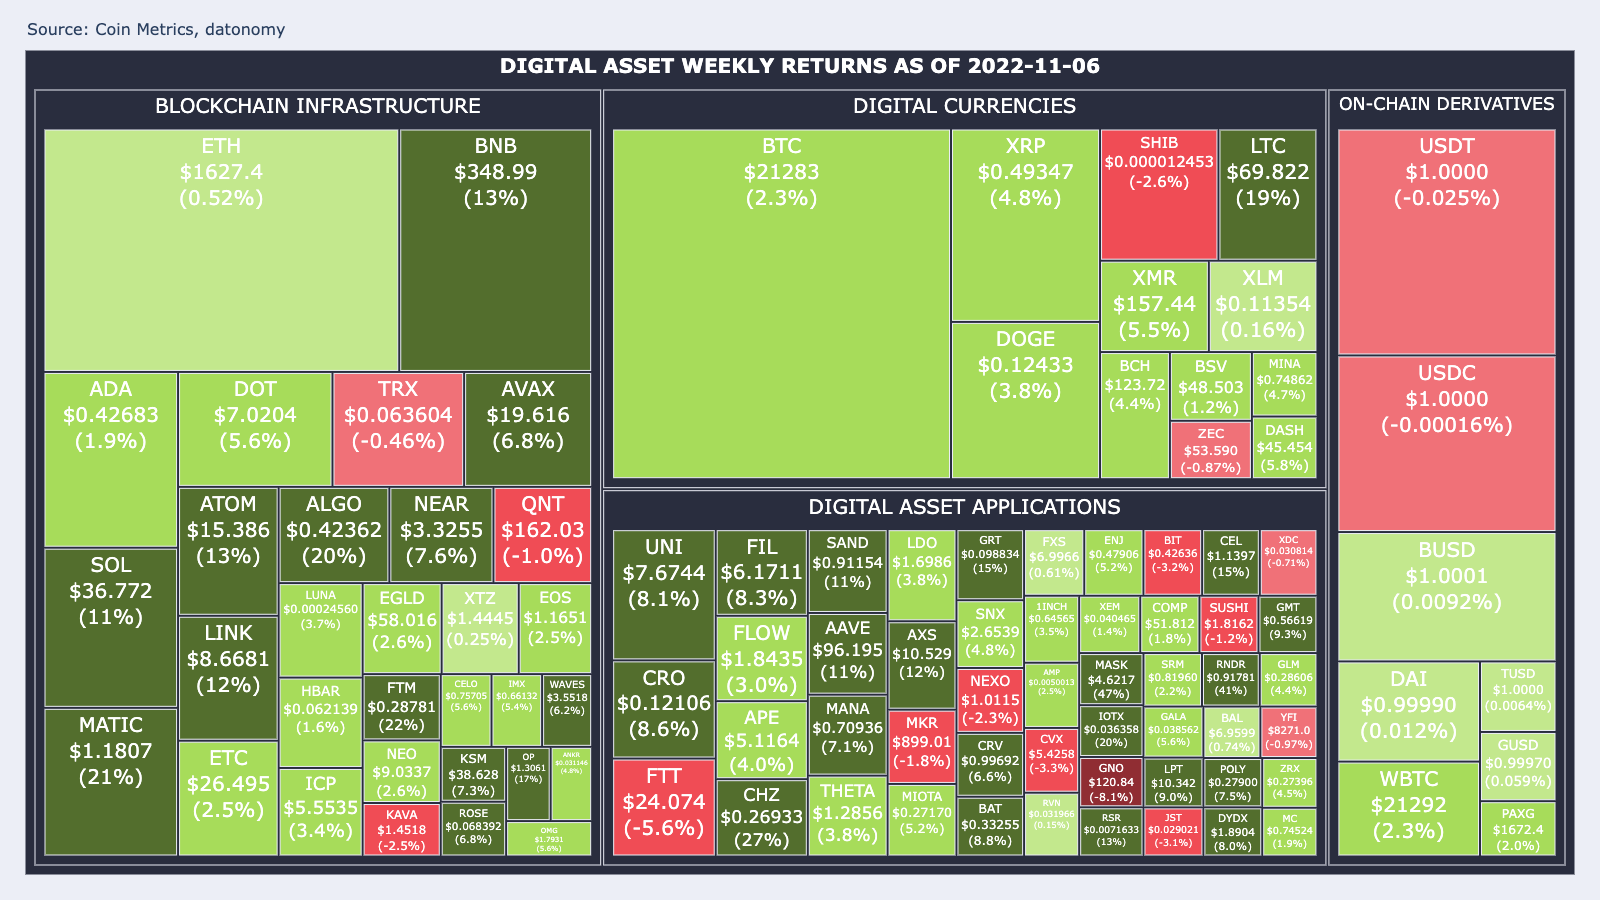
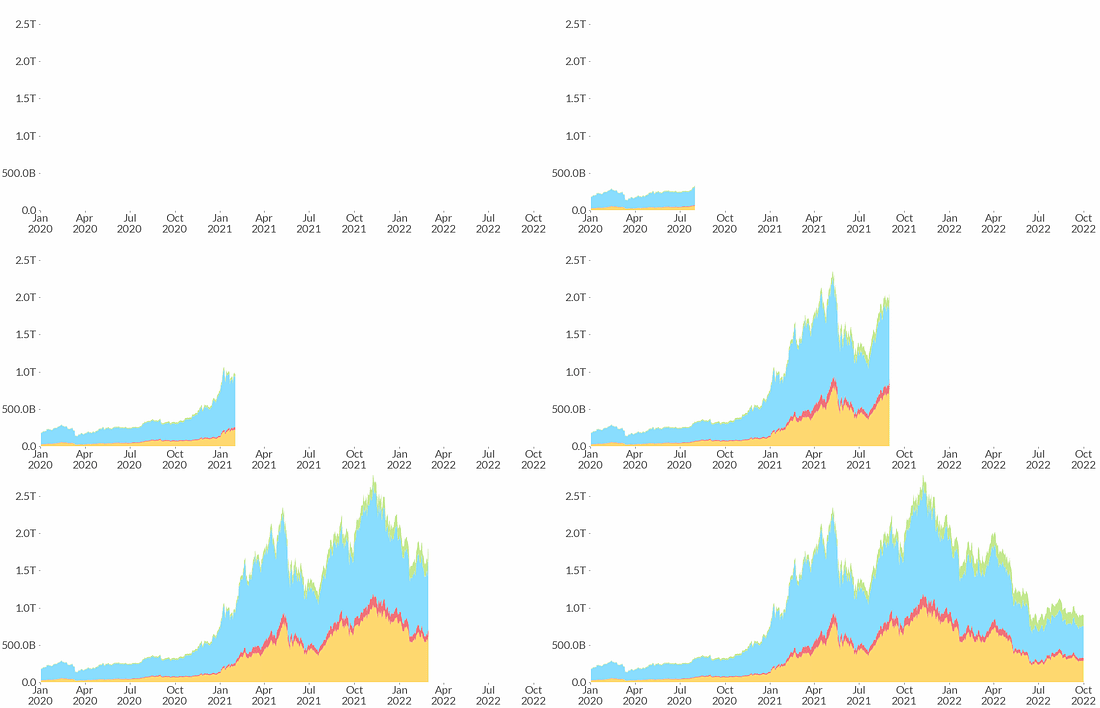
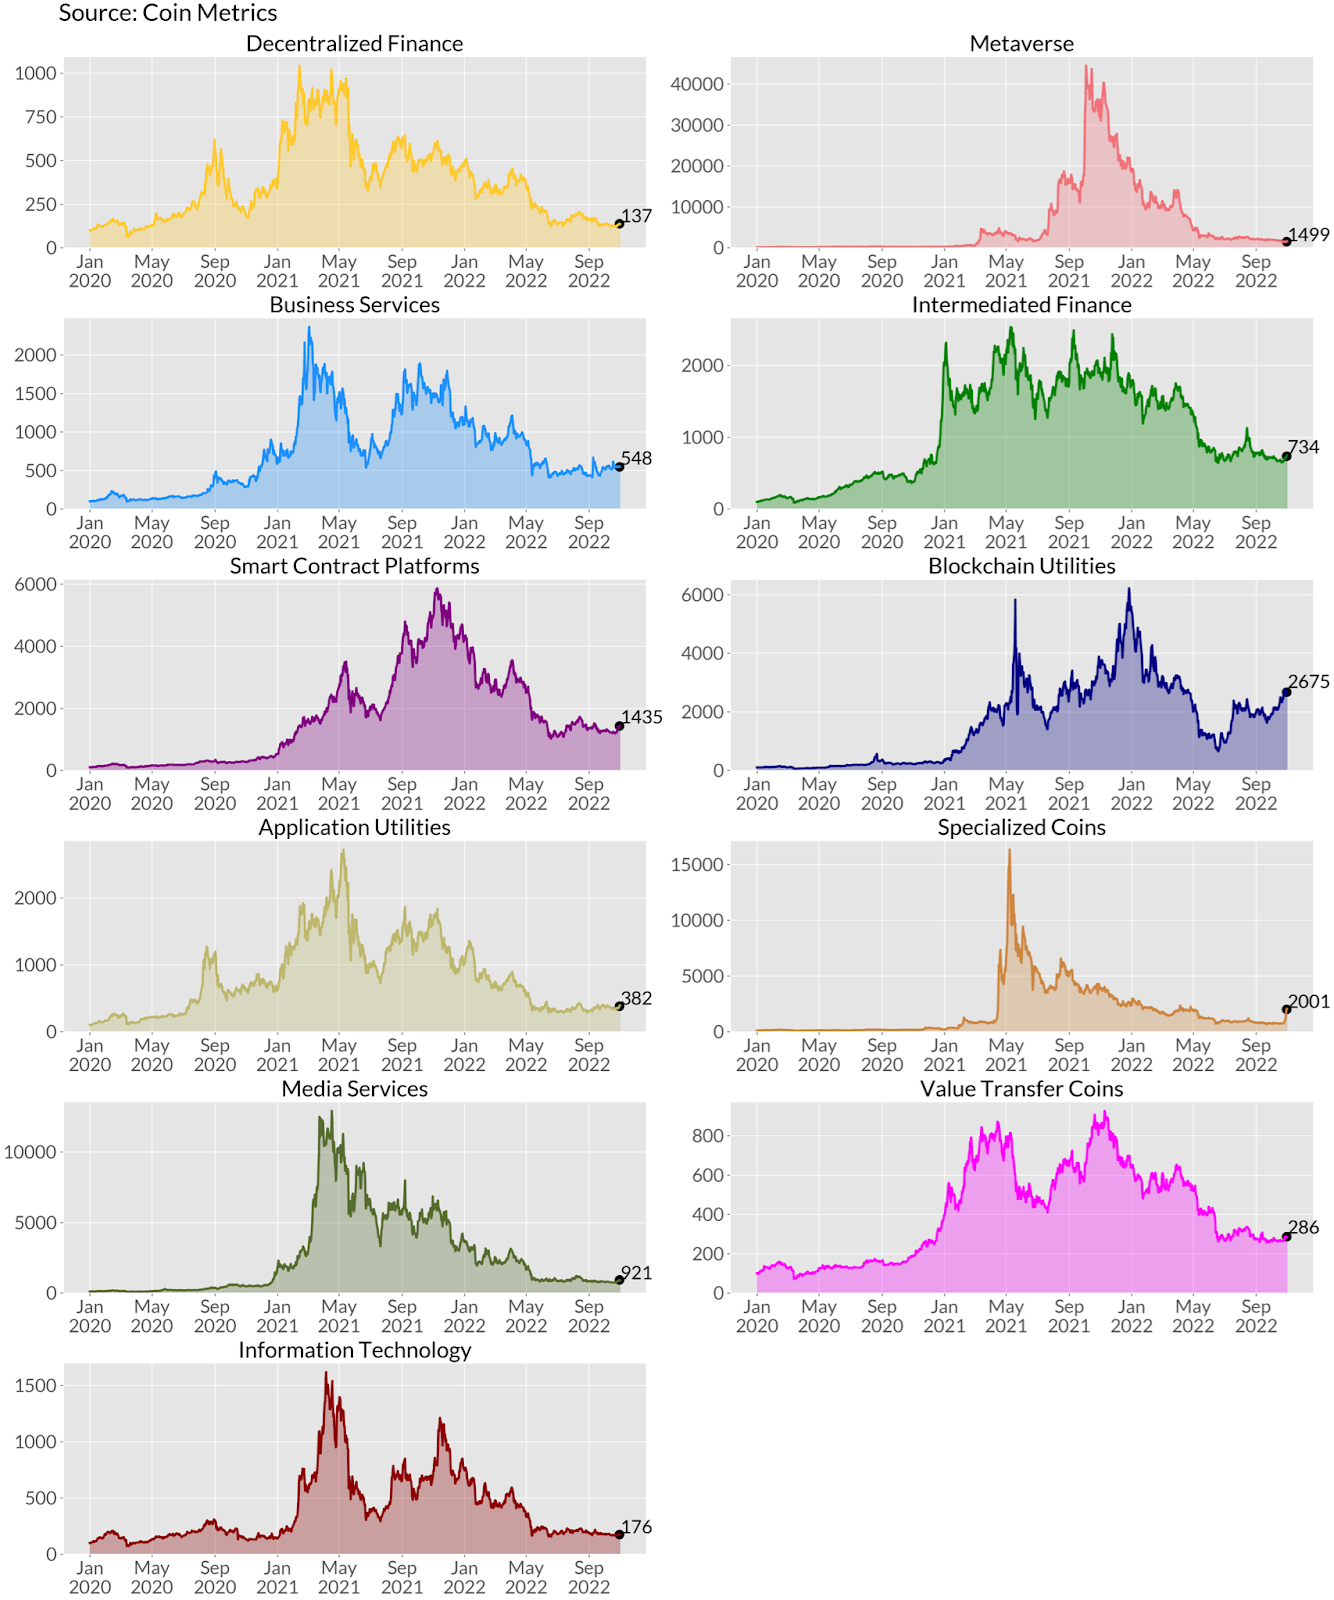
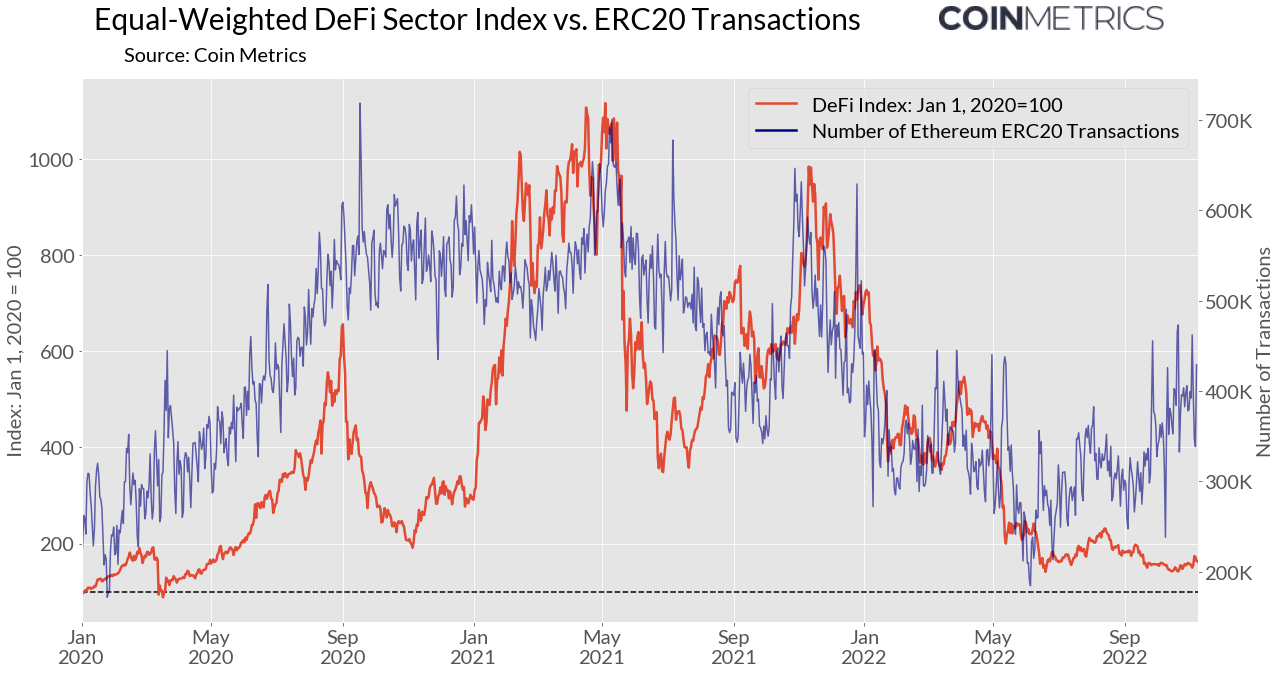
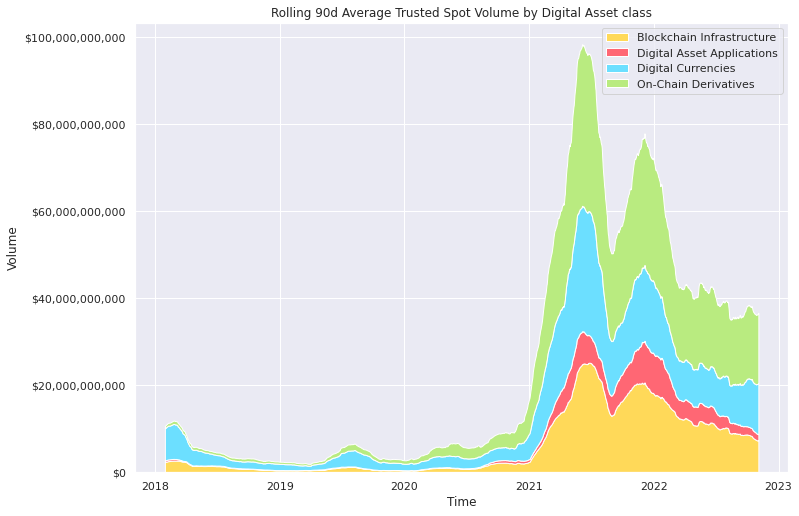
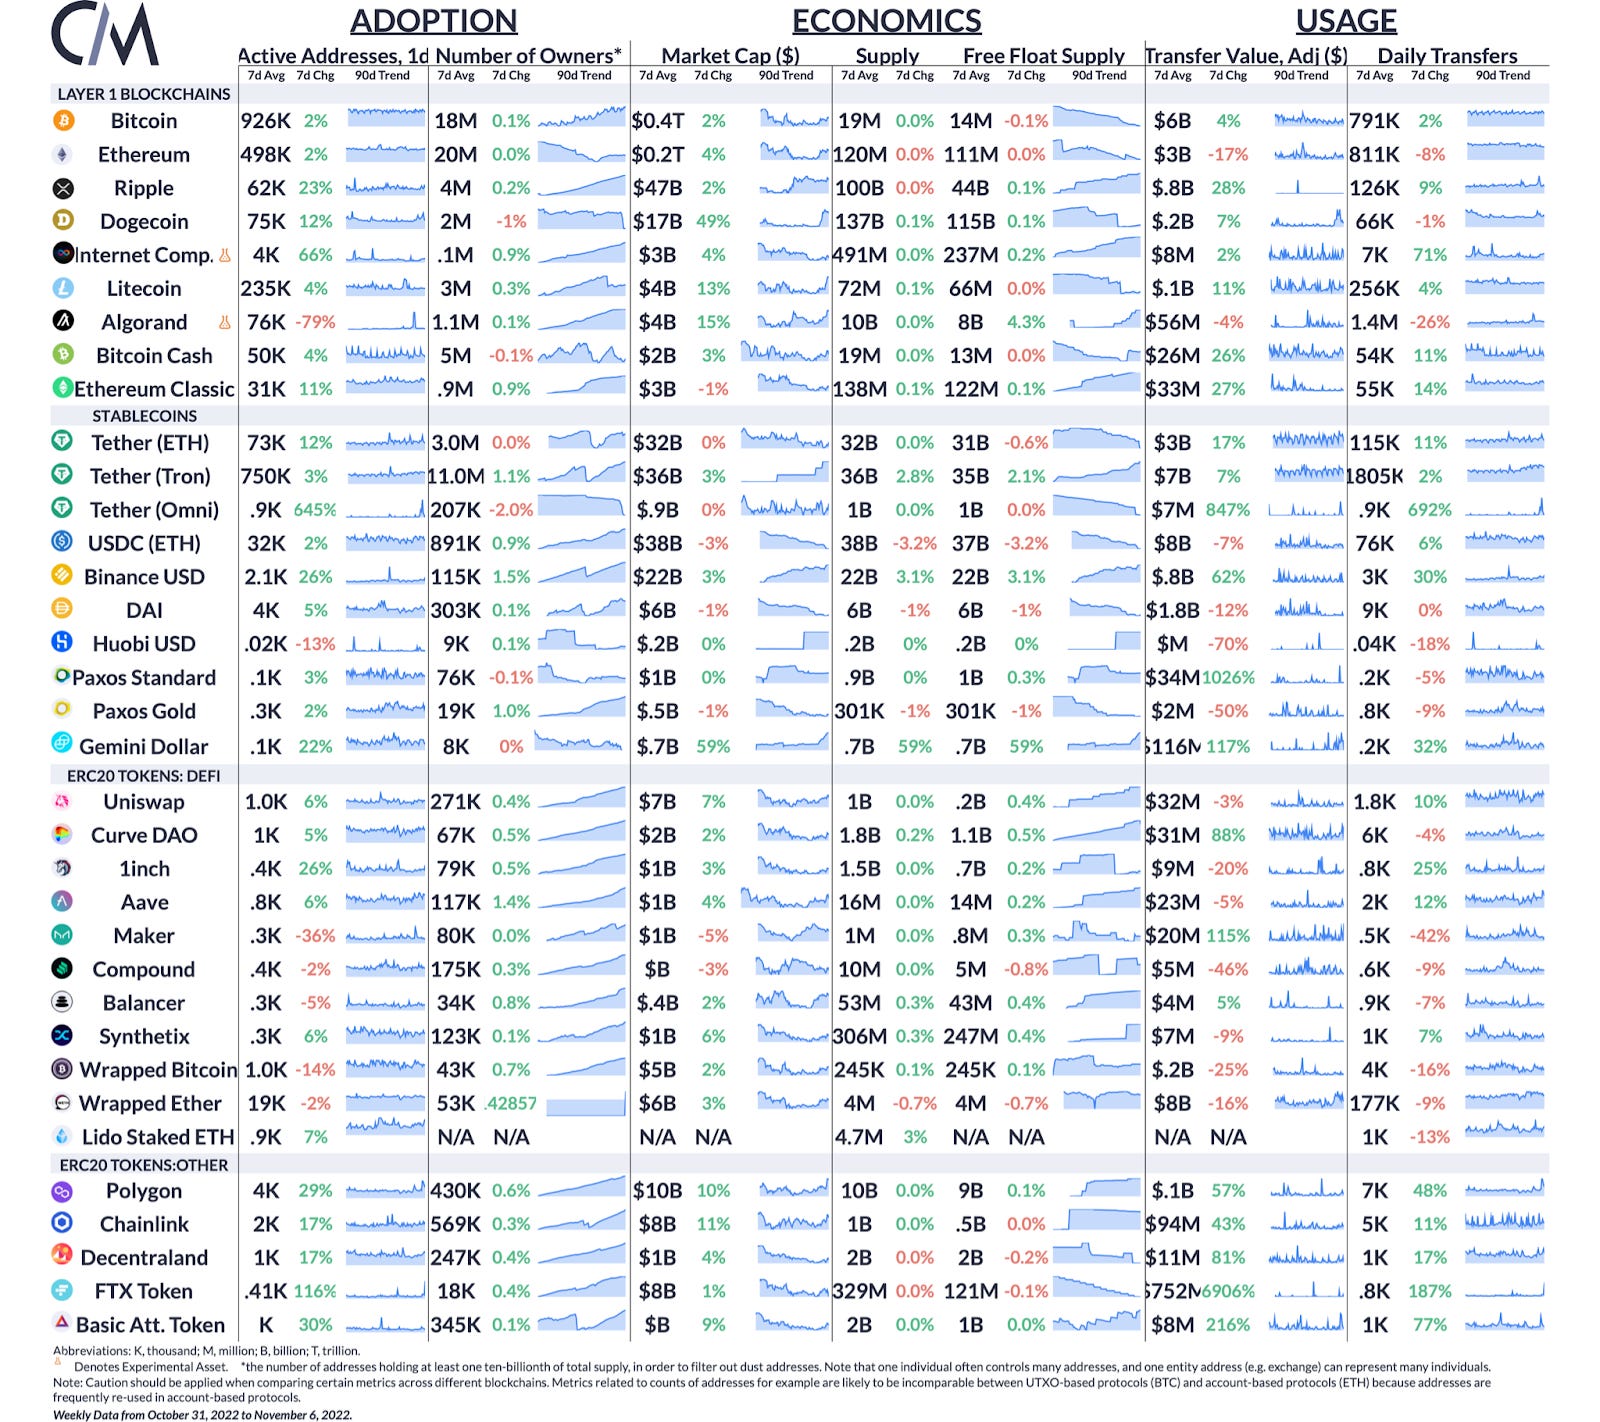
Get the best data-driven crypto insights and analysis every week: Introducing datonomy™: A Digital Assets TaxonomyBy Victor Ramirez, Kyle Waters, Matías Andrade, and Nate Maddrey More than a decade has passed since bitcoin was launched as crypto’s first digital currency; the digital asset ecosystem has grown exponentially in breadth and complexity. Coin Metrics counts thousands of coins across our suite of data products. To make the space easier to navigate, Coin Metrics collaborated with Goldman Sachs and MSCI to create datonomy™, a taxonomy for classifying digital assets. Datonomy is designed to be intuitive to the average investor while remaining true to the language of the crypto industry. Importantly, it allows investors the same structural framework for investing in the “Decentralized Finance Sector” the same way that they would traditionally invest in, say, the “Energy Sector.” Source: Coin Metrics Crucially, datonomy classifies assets primarily based on their economic context of use. This contrasts with a purely technical taxonomy, or one that confounds the technical and economic characteristics of tokens and their protocols. Economic use-cases tend to behave differently from architecture, as protocols often change their design over time. Some examples include BNB branching from an Ethereum token to its own smart contract platform, and decentralized exchange dYdX moving from Ethereum to its own application-specific blockchain in Cosmos. From a researcher’s perspective, it unlocks a new lens for analyzing broad trends on an aggregate scale. In this week’s issue of State of the Network, we offer a sample selection of crypto data analysis uniquely enabled by datonomy and the datonomy API. Sector Market CapBy placing assets into designated classes and combining crypto asset returns data from Coin Metrics market data, we can easily create analyses measuring performance by class. The chart below shows the weekly returns of the top 100 assets, aggregated up to their respective class—the broadest classification level in datonomy. Source: Coin Metrics We can easily create analyses measuring relative market dominance by class. The charts below shows the evolution of market value by asset class for each month since January 2020. Source: Coin Metrics *Absolute numbers are calculated based on datonomy's 200+ assets and do not include unclassified assets. A few key market trends stand out from this high-level view of the data. First, the rapid rise of stablecoins is noticeable in the growth of the on-chain derivatives class. On-chain derivatives have grown to 16% of digital asset market capitalization as of today, from under 3% at the beginning of 2020. A second large trend is the acceleration of DeFi, NFTs, and smart contract platforms, reflected in the rising share of market capitalization attributable to blockchain infrastructure and digital asset applications. This trend largely echoes an acknowledgement among industry experts that “money” (i.e., Digital Currencies) is simply one application of blockchain technology. In recent years, we have witnessed a surge in blockchain applications moving far beyond simple transfers of value including financial applications, art, collectibles, virtual worlds, digital identity, and more. Returns By Asset SectorThe datonomy serves as a great instrument to judge and examine the relative strength and performance of various crypto assets and the narratives that propel them. The chart below may illustrate the relative performance of various token subcategories. These are weighted by their market capitalization to track performance representatively between assets of different categories. We must stress that this construction is purely for illustrative purposes, and this methodology is not comparable to methods used for investment analysis or index construction. With that caveat in mind, a quick look at this chart’s axes reveals the staggering returns observed in the Metaverse asset category. An important catalyst was Facebook’s rebranding to Meta in late October of 2021, near the peak of the trend. Meta’s commitment to develop and invest in a “metaverse” of their own led to public speculation across many digital assets in this sector, precipitating close to 40,000% appreciation during the period. Although these valuations were not sustained after they peaked, it is still one of the better-performing sectors to date. Source: Coin Metrics Another trend in the Decentralized Finance sector of the chart above is "DeFi Summer" during 2020, when DeFi lending and farming protocols began gaining traction and reached a peak value of over 500% in September of 2020. It is noteworthy that the returns have all but vanished—currently at only 37% over the initial balance, which is indicative of the distribution of profits earned by DeFi protocols to users. Finally, we can judge the timing of various peaks and troughs in the relative returns of these sectors to uncover the dominant narratives driving price action. While correlation among digital assets is consistently high, a potent driving force can be identified with this analysis. For instance, we notice the Metaverse sector peaked after "DeFi Summer," and also that, as of late, Blockchain Utilities appear to be gaining traction relative to other sectors. This sort of "narrative analysis" can provide a compelling jumping-off point for investors to identify developing trends, and may help justify a deep-dive into a sector and its constituents. Combining datonomy with On-Chain DataWe can also expand our analysis beyond market cap and returns data using Coin Metrics’ network (i.e. on-chain) data. To understand the distinction between “on-chain” and “off-chain” data, check out our recent State of the Network on the topic here. Using real-time activity data from the blockchain enriches our understanding of a sector’s trends and cycles. In the example below, we created a simple equal-weighted index of returns for assets in the decentralized finance (DeFi) sector (in red). Plotted in blue is the number of ERC-20 token transactions that occurred on Ethereum each day. This is a good proxy for DeFi activity because the majority of DeFi activity (lending, borrowing, or swaps) involves ERC-20 tokens such as USD stablecoins. When ERC-20 token activity grew considerably during the explosion of DeFi applications in the DeFi summer of 2020, the sector’s returns followed closely. This trend is also noticeable in the increased activity in Spring 2021 and Fall 2021. Interestingly, the correlation has broken a bit in recent months as activity has risen relative to months prior, but the DeFi sector’s returns remain subdued. Source: Coin Metrics Network Data There are many other ways to combine network data with the new taxonomy. For example, one could compare the returns of the NFT sector to on-chain sales volume of NFTs. Macro indicators could also be formed using measures like transaction value settled, fees paid, or active addresses across smart contract platforms to gauge real adoption. Volume Dominance by Digital Asset ClassVolume has also trended significantly over the past five years. Despite depressed market conditions, trusted volume* across the asset class is multiples higher than the peak of the 2017 bull run. Volume across digital asset classes has also diversified over time. The majority of volume was concentrated in Digital Currencies (bitcoin, litecoin, etc.) until mid–2020. Since then, On-Chain Derivatives (which consist of stablecoins and wrapped tokens) and Blockchain Infrastructure tokens (which consist of smart contract platforms, among others) have emerged. *Trusted volume is meant to filter out ‘fake’ volume that can be measured across some crypto exchanges. Source: Coin Metrics ConclusionPublic blockchains have demonstrated their utility across multiple domains, expanding beyond finance and into media, arts, gaming, identity, and much more. Understanding an emerging, multidisciplinary, and fast-paced industry such as crypto can be daunting for the average person. Adding to the confusion is that technical design patterns are often interlaced with a project’s economic use-case. The vision for datonomy is to elucidate how the crypto market is organized for everyone. From an asset manager’s perspective, datonomy provides a framework for thematic investment parallel to GICS (Global Industry Classification Standard). To a researcher, a crypto taxonomy allows for more organized and aggregated industry analyses. Finally, for the average crypto market observer, a consistent and standardized taxonomy will enable us to build intuition about the market the same way we do for stocks. As the market continues to mature, we hope datonomy will be an essential tool in developing fluency in the crypto industry. Network Data InsightsSummary MetricsSource: Coin Metrics Network Data Pro Crypto markets enjoyed a respite from the bear market and we witnessed an increase in on-chain activity across the board. In recent news, Binance has decided to liquidate its holdings of the FTX Token (FTT) from their books entirely, which has prompted a tremendous amount of on-chain transfers of FTT in the last week—more than $752M. In stablecoin-related news, MakerDAO has partnered with crypto exchange Gemini to onboard the GUSD stablecoin as a collateral type. Historically one of the smaller stablecoins by supply, GUSD supply has accelerated to a new all-time high of just over $800M. Over $470M GUSD has flowed into the Maker system since late October. Coin Metrics UpdatesThis week’s updates from the Coin Metrics team:
As always, if you have any feedback or requests please let us know here. Subscribe and Past IssuesCoin Metrics’ State of the Network is an unbiased, weekly view of the crypto market informed by our own network (on-chain) and market data. If you'd like to get State of the Network in your inbox, please subscribe here. You can see previous issues of State of the Network here. © 2022 Coin Metrics Inc. All rights reserved. Redistribution is not permitted without consent. This newsletter does not constitute investment advice and is for informational purposes only and you should not make an investment decision on the basis of this information. The newsletter is provided “as is” and Coin Metrics will not be liable for any loss or damage resulting from information obtained from the newsletter.If you liked this post from Coin Metrics' State of the Network, why not share it? |
Older messages
Coin Metrics’ State of the Network: Issue 179
Tuesday, November 1, 2022
Tuesday, November 1st, 2022
Coin Metrics’ State of the Network: Issue 178
Tuesday, October 25, 2022
Tuesday, October 25th, 2022
Coin Metrics' State of the Network: Issue 177
Tuesday, October 18, 2022
Tuesday, October 18th, 2022
Coin Metrics' State of the Network: Issue 176
Tuesday, October 11, 2022
Tuesday, October 10th, 2022
Coin Metrics' State of the Network: Issue 175
Tuesday, October 4, 2022
Tuesday, October 4th, 2022
You Might Also Like
Central African Republic’s CAR memecoin raises scrutiny
Friday, February 14, 2025
Allegations of deepfake videos and opaque token distribution cast doubts on CAR's ambitious memecoin project. ͏ ͏ ͏ ͏ ͏ ͏ ͏ ͏ ͏ ͏ ͏ ͏ ͏ ͏ ͏ ͏ ͏ ͏ ͏ ͏ ͏ ͏ ͏ ͏ ͏ ͏ ͏ ͏ ͏ ͏ ͏ ͏ ͏ ͏ ͏ ͏ ͏ ͏ ͏ ͏ ͏ ͏ ͏ ͏
January CEX Data Report: Significant Declines in Trading Volume Across Major CEXs, Spot Down 25%, Derivatives Down…
Friday, February 14, 2025
According to data collected by the WuBlockchain team, spot trading volume on major central exchanges in January 2025 decreased by 25% compared to December 2024. ͏ ͏ ͏ ͏ ͏ ͏ ͏ ͏ ͏ ͏ ͏ ͏ ͏ ͏ ͏ ͏ ͏ ͏ ͏ ͏
Previewing Coinbase Q4 2024 Earnings
Friday, February 14, 2025
Estimating Coinbase's Transaction and Subscriptions & Services Revenue in Q4 2024 ͏ ͏ ͏ ͏ ͏ ͏ ͏ ͏ ͏ ͏ ͏ ͏ ͏ ͏ ͏ ͏ ͏ ͏ ͏ ͏ ͏ ͏ ͏ ͏ ͏ ͏ ͏ ͏ ͏ ͏ ͏ ͏ ͏ ͏ ͏ ͏ ͏ ͏ ͏ ͏ ͏ ͏ ͏ ͏ ͏ ͏ ͏ ͏ ͏ ͏ ͏ ͏ ͏ ͏ ͏ ͏
ADA outperforms Bitcoin as Grayscale seeks approval for first US Cardano ETF in SEC filing
Friday, February 14, 2025
Grayscale's Cardano ETF filing could reshape ADA's market position amid regulatory uncertainty ͏ ͏ ͏ ͏ ͏ ͏ ͏ ͏ ͏ ͏ ͏ ͏ ͏ ͏ ͏ ͏ ͏ ͏ ͏ ͏ ͏ ͏ ͏ ͏ ͏ ͏ ͏ ͏ ͏ ͏ ͏ ͏ ͏ ͏ ͏ ͏ ͏ ͏ ͏ ͏ ͏ ͏ ͏ ͏ ͏ ͏ ͏ ͏ ͏
AI project trading tips: investment targets and position management
Friday, February 14, 2025
This interview delves into the investment trends, market landscape, and future opportunities within AI Agent projects. ͏ ͏ ͏ ͏ ͏ ͏ ͏ ͏ ͏ ͏ ͏ ͏ ͏ ͏ ͏ ͏ ͏ ͏ ͏ ͏ ͏ ͏ ͏ ͏ ͏ ͏ ͏ ͏ ͏ ͏ ͏ ͏ ͏ ͏ ͏ ͏ ͏ ͏ ͏ ͏ ͏
DeFi & L1L2 Weekly — 📈 Polymarket recorded a new high of 462.6k active users in Jan despite volume dip; Holesky a…
Friday, February 14, 2025
Polymarket recorded a new high of 462600 active users in January despite volume dip; Holesky and Sepolia testnets are scheduled to fork in Feb and Mar for Ethereum's Pectra upgrade. ͏ ͏ ͏ ͏ ͏ ͏ ͏ ͏
Donald Trump taps crypto advocate a16z’s Brian Quintenz for CFTC leadership
Friday, February 14, 2025
Industry leaders back Brian Quintenz's nomination, highlighting his past efforts at the CFTC and potential to revamp crypto oversight. ͏ ͏ ͏ ͏ ͏ ͏ ͏ ͏ ͏ ͏ ͏ ͏ ͏ ͏ ͏ ͏ ͏ ͏ ͏ ͏ ͏ ͏ ͏ ͏ ͏ ͏ ͏ ͏ ͏ ͏ ͏
⚡10 Tips to Make a Living Selling Info Products
Friday, February 14, 2025
PLUS: the best links, events, and jokes of the week → ͏ ͏ ͏ ͏ ͏ ͏ ͏ ͏ ͏ ͏ ͏ ͏ ͏ ͏ ͏ ͏ ͏ ͏ ͏ ͏ ͏ ͏ ͏ ͏ ͏ ͏ ͏ ͏ ͏ ͏ ͏ ͏ ͏ ͏ ͏ ͏ ͏ ͏ ͏ ͏ ͏ ͏ ͏ ͏ ͏ ͏ ͏ ͏ ͏ ͏ ͏ ͏ ͏ ͏ ͏ ͏ ͏ ͏ ͏ ͏ ͏ ͏ ͏ ͏ ͏ ͏ ͏ ͏ ͏ ͏ ͏ ͏ ͏ ͏
Interview with CryptoD: How He Made $17 Million Profit on TRUMP Coin
Friday, February 14, 2025
Author | WUblockchain, Foresight News ͏ ͏ ͏ ͏ ͏ ͏ ͏ ͏ ͏ ͏ ͏ ͏ ͏ ͏ ͏ ͏ ͏ ͏ ͏ ͏ ͏ ͏ ͏ ͏ ͏ ͏ ͏ ͏ ͏ ͏ ͏ ͏ ͏ ͏ ͏ ͏ ͏ ͏ ͏ ͏ ͏ ͏ ͏ ͏ ͏ ͏ ͏ ͏ ͏ ͏ ͏ ͏ ͏ ͏ ͏ ͏ ͏ ͏ ͏ ͏ ͏ ͏ ͏ ͏ ͏ ͏ ͏ ͏ ͏ ͏ ͏ ͏ ͏ ͏ ͏ ͏ ͏ ͏ ͏ ͏ ͏ ͏

