Coin Metrics’ State of the Network: Issue 209
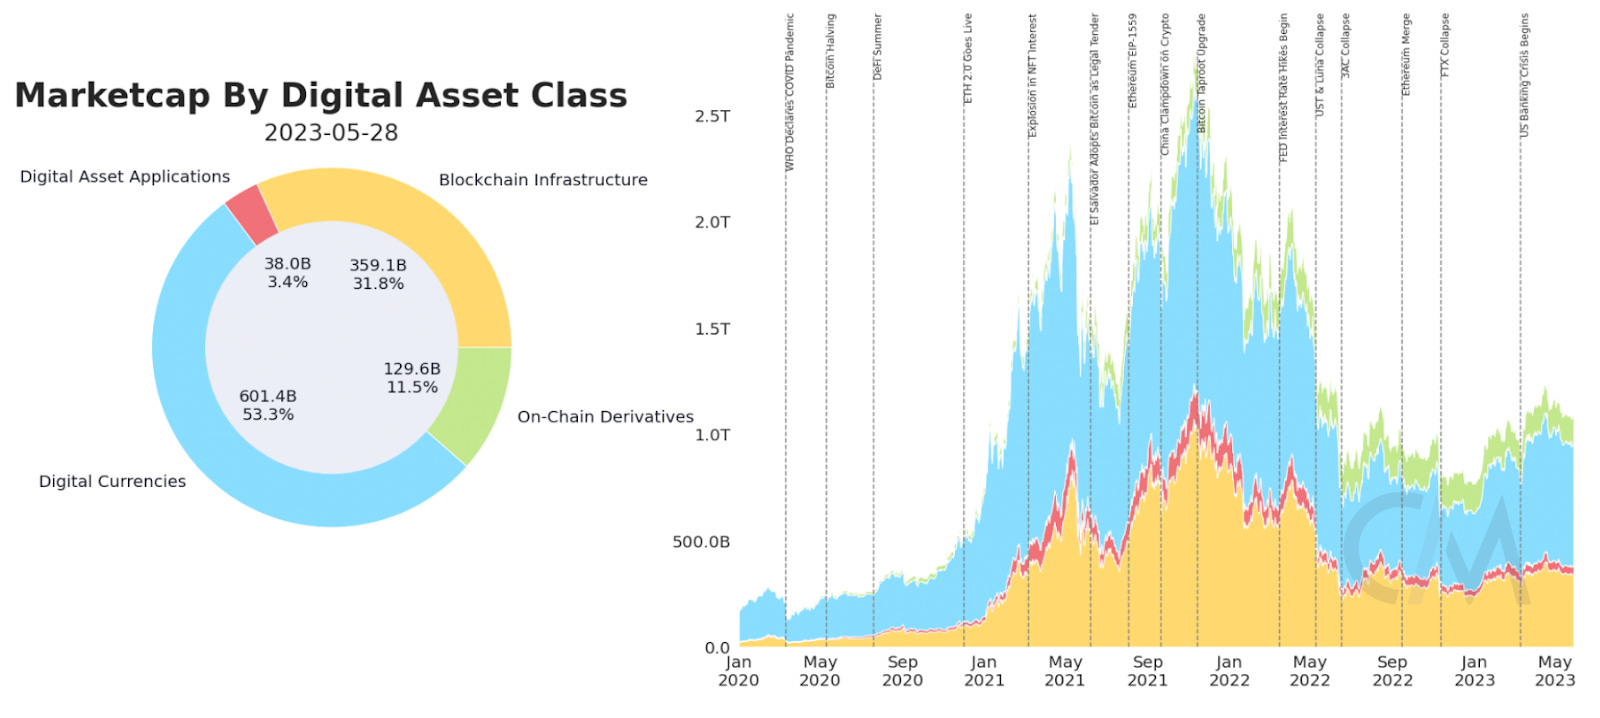
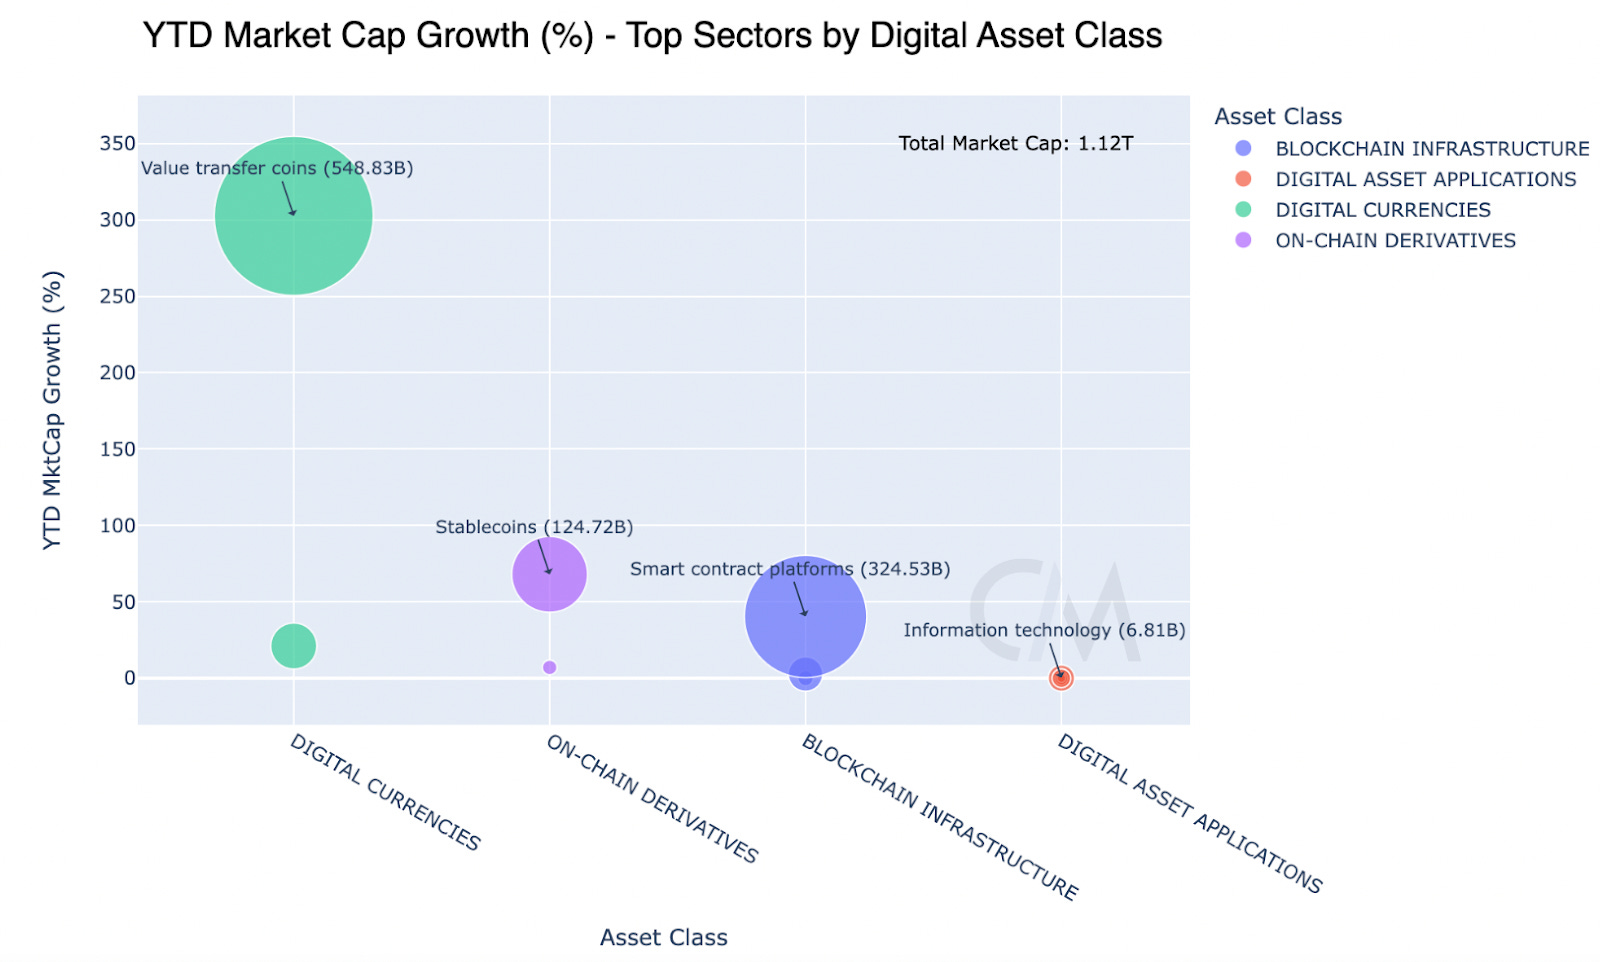
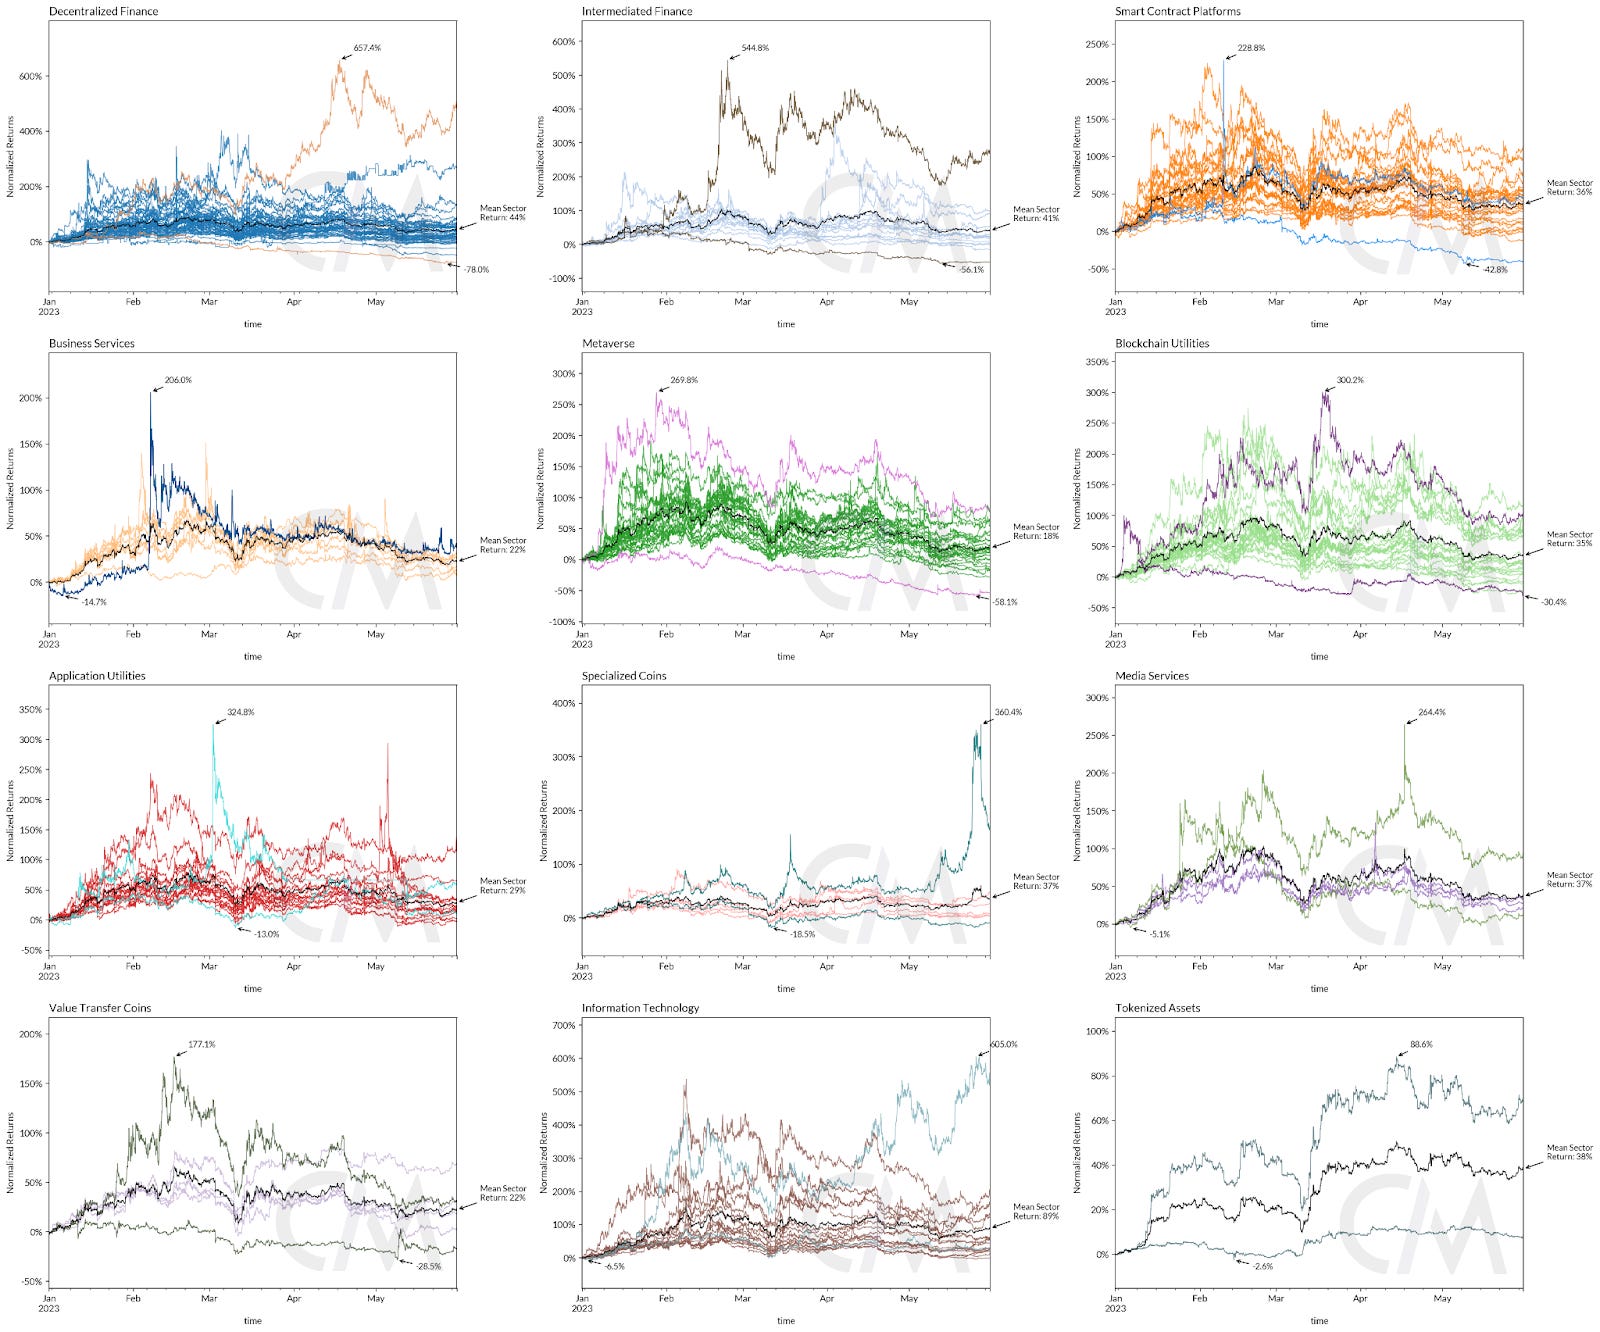
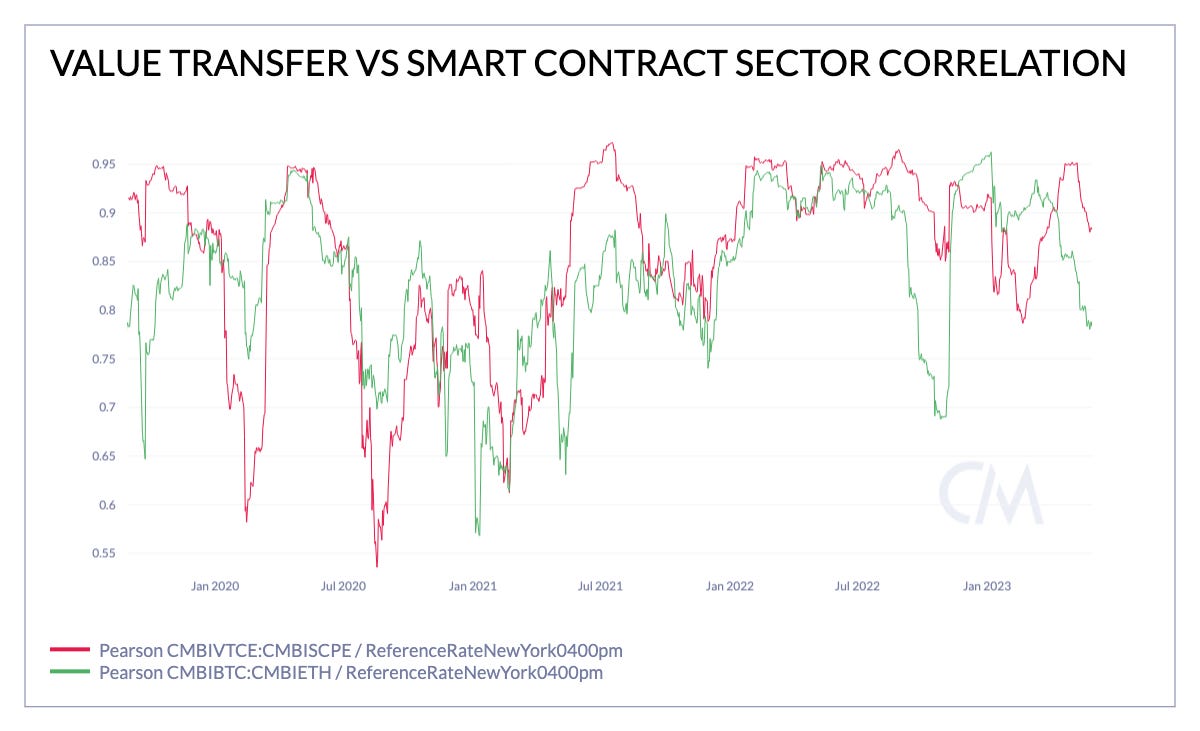
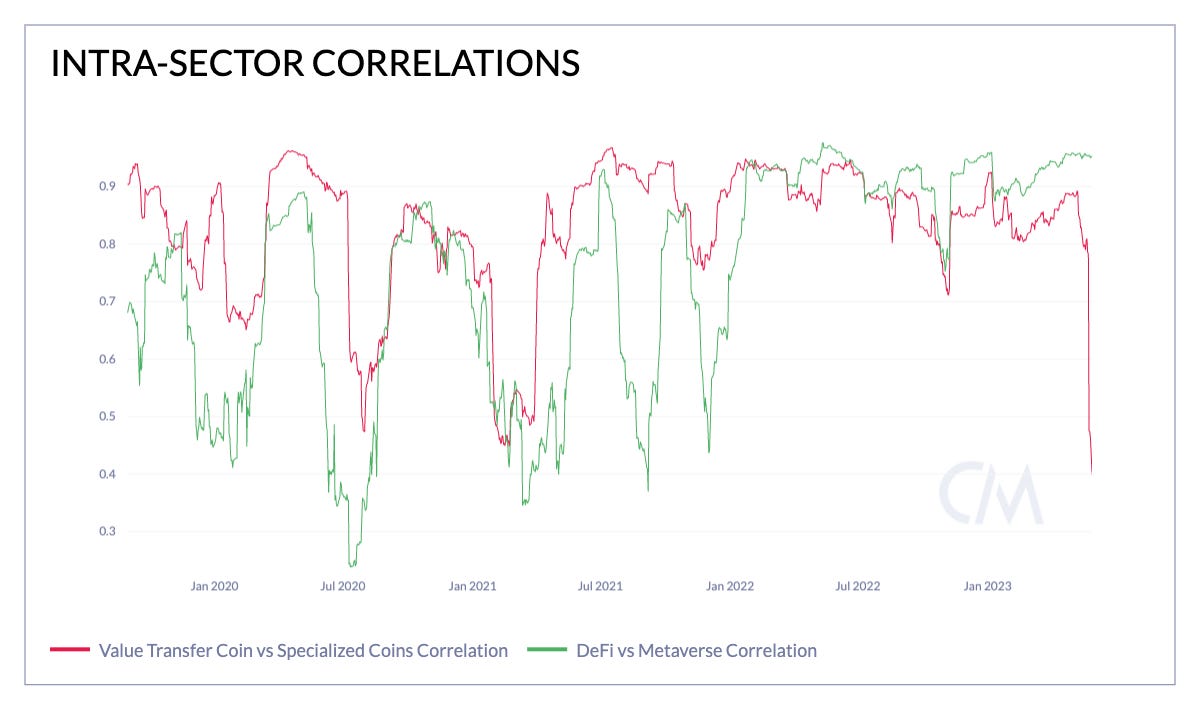
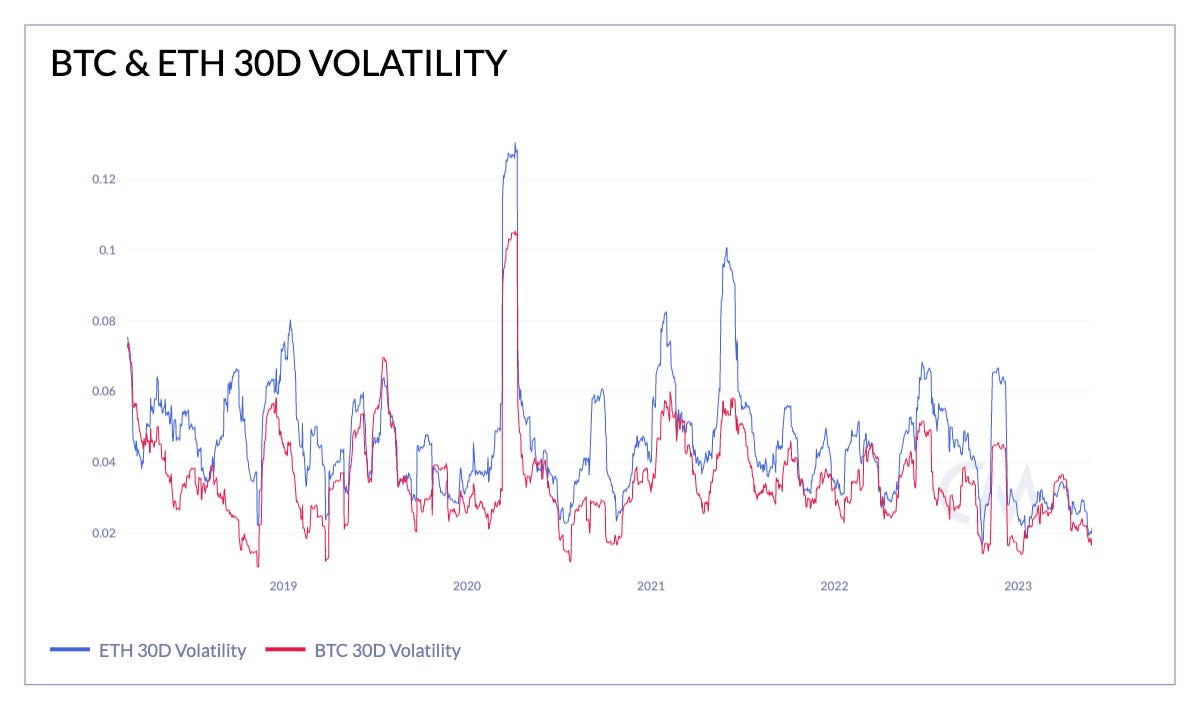
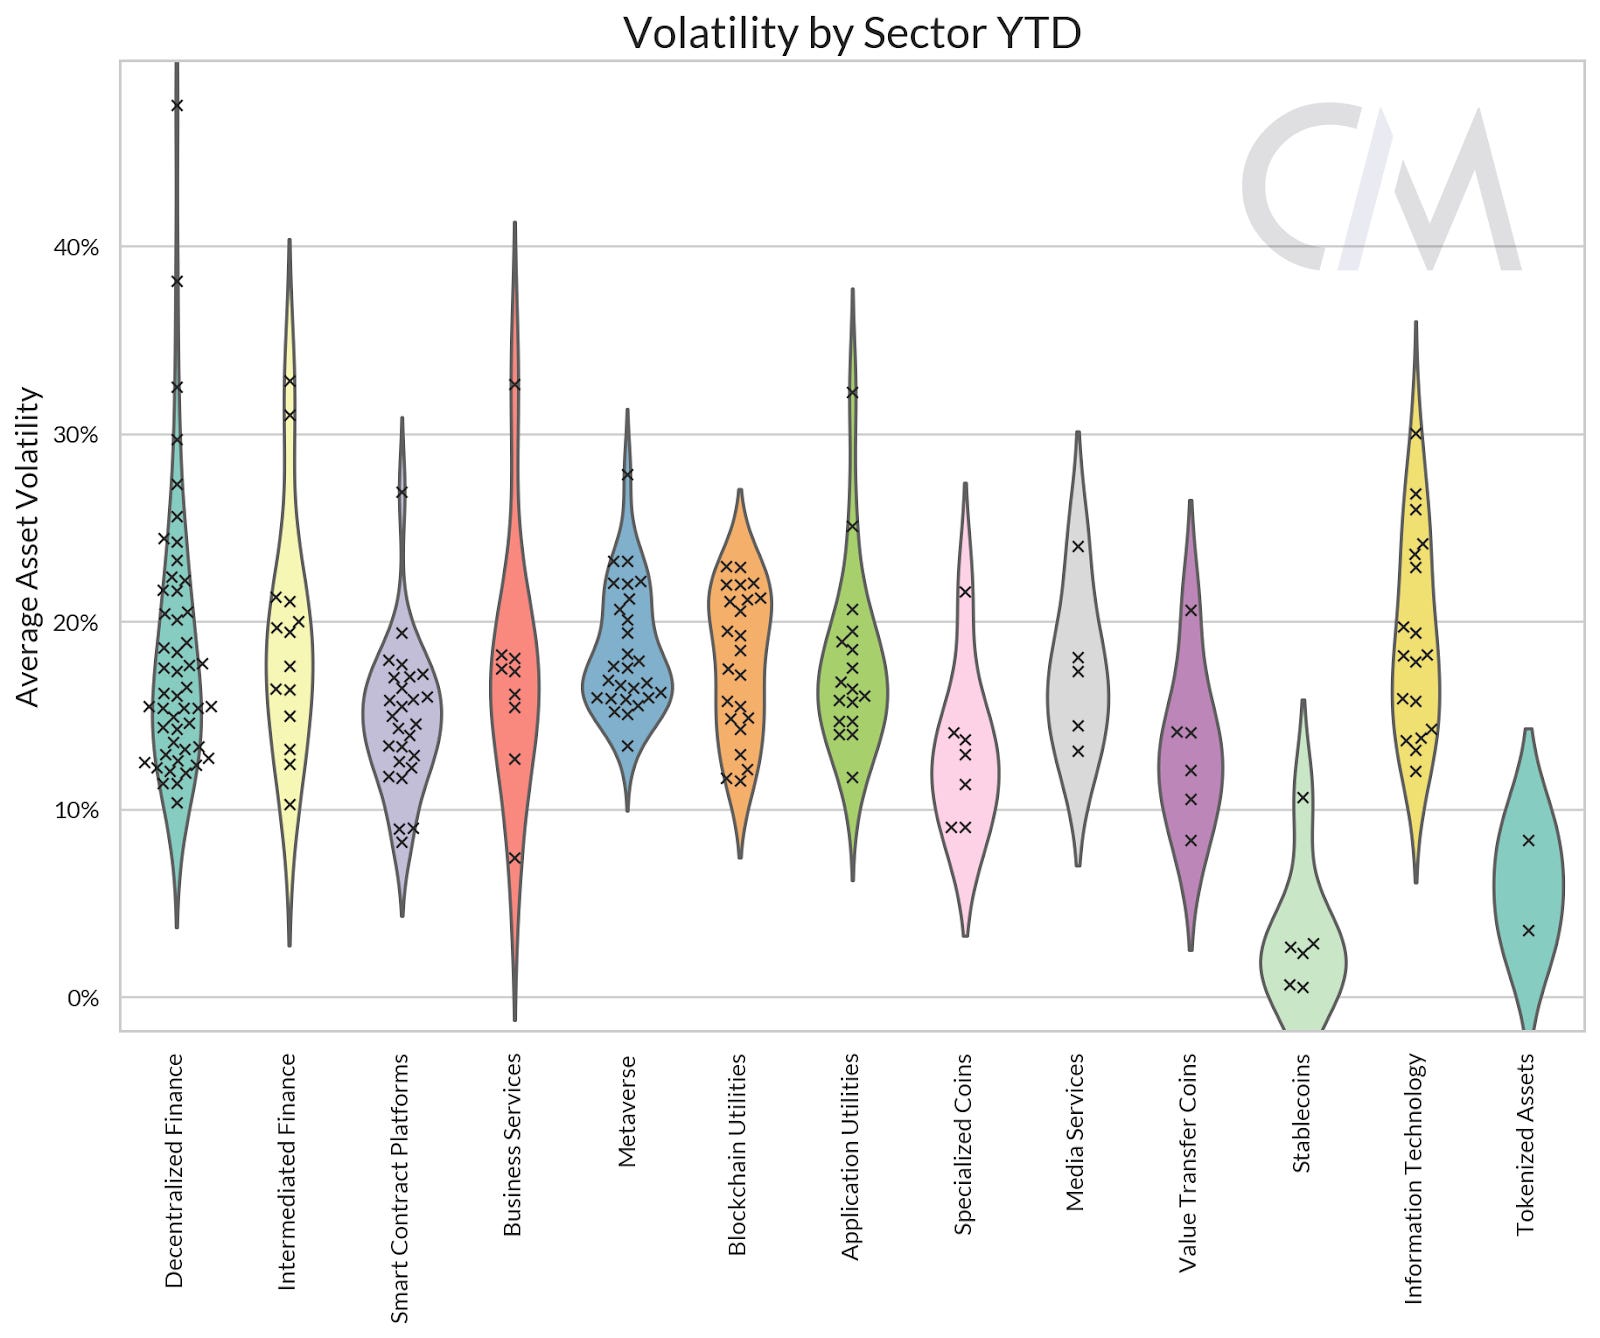
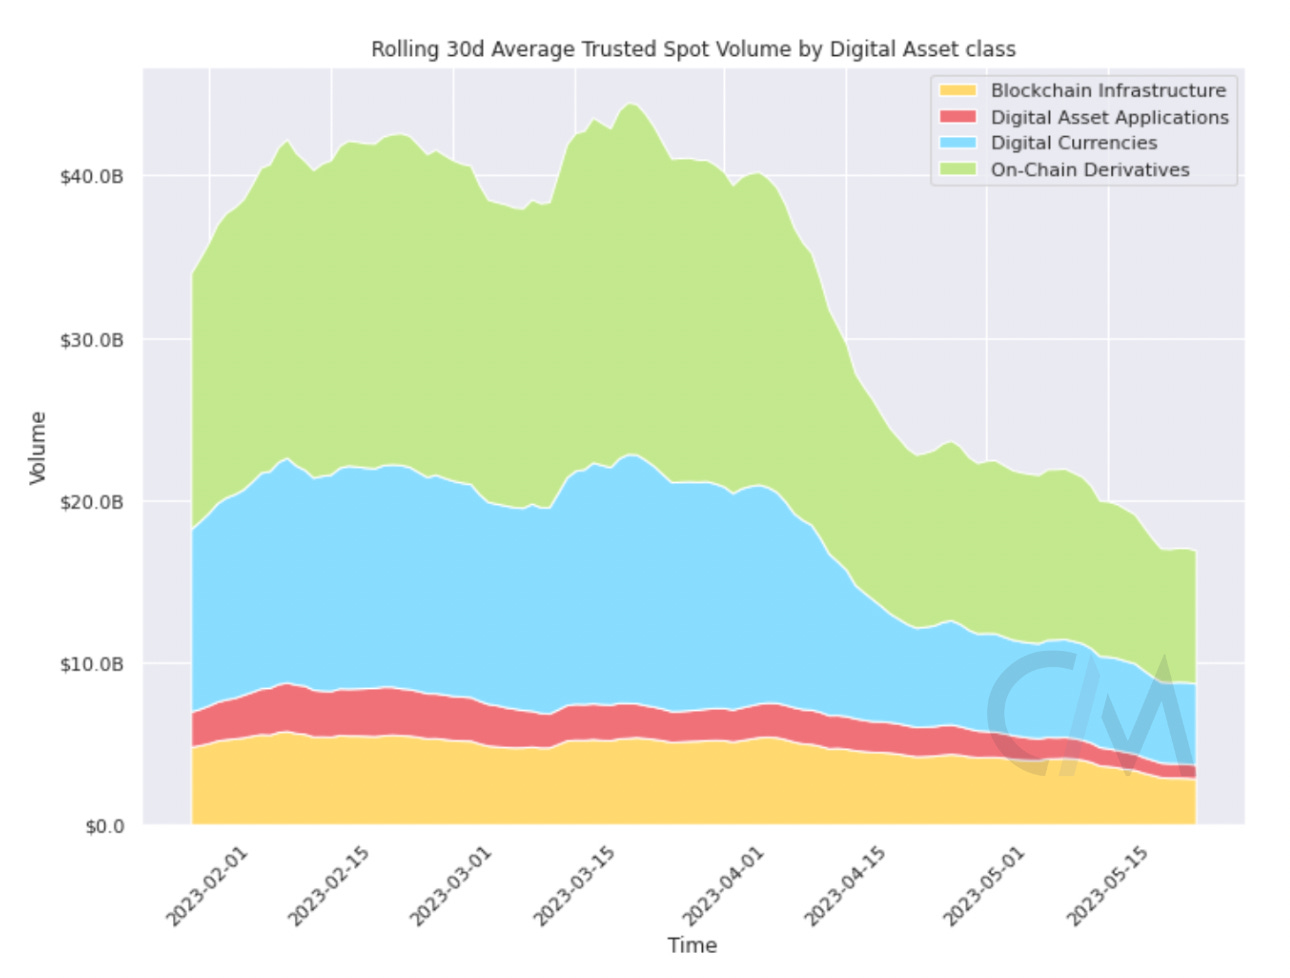
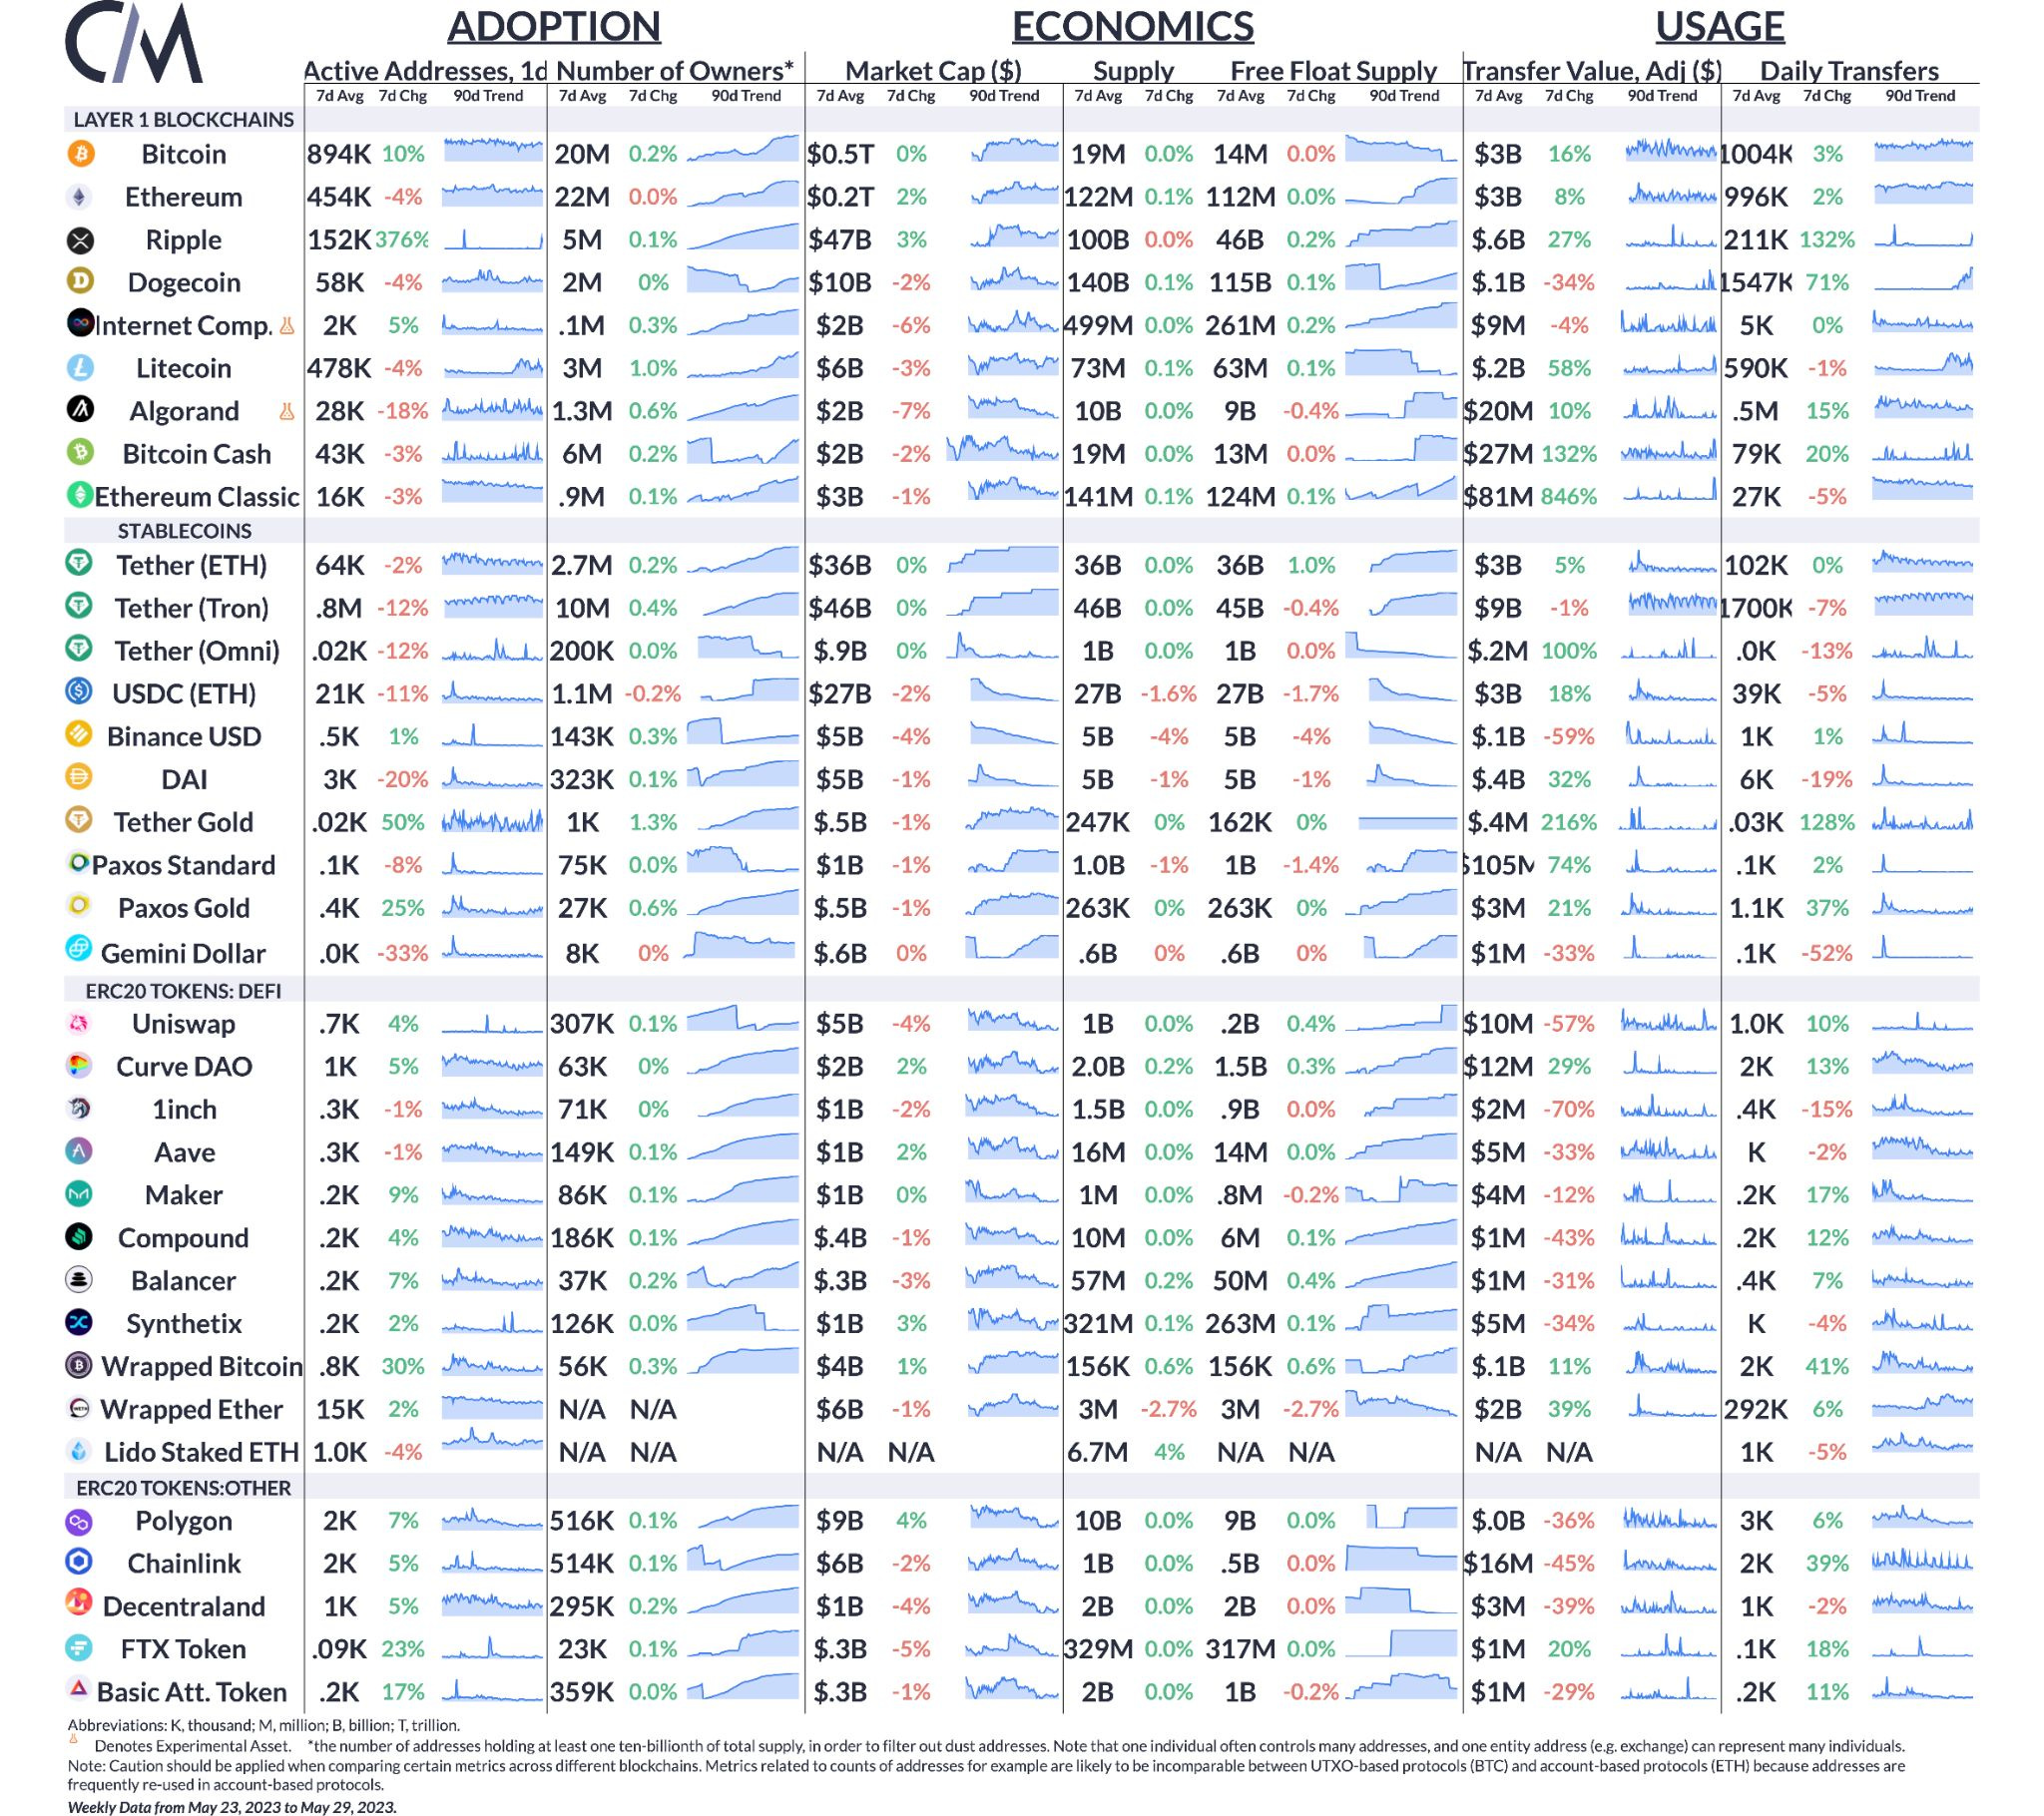
Coin Metrics’ State of the Network: Issue 209Zooming out at digital asset market caps, returns, sector correlations & volatilityGet the best data-driven crypto insights and analysis every week: Zooming Out: A datonomy UpdateBy: Tanay Ved & Matías Andrade On the back of an eventful five-month period, digital asset markets have displayed remarkable resilience despite encountering challenges like the disruption in the US banking sector and an increasingly stringent regulatory landscape. Amidst these external factors, significant progress and milestones have emerged within the ecosystem. Ethereum's successful implementation of the Shapella upgrade, alongside exploratory endeavors involving Ordinals and BRC-20 on Bitcoin, have garnered significant attention. Additionally, the exuberance surrounding memecoins has propelled fee markets on major digital assets to unprecedented heights. As we transition into a relatively calmer environment, it becomes crucial to adopt a broader perspective and gain insights into our current standing within the vast digital asset ecosystem. In this issue of Coin Metrics’ State of the Network, we leverage datonomy—a classification system for digital assets to zoom out and gauge the ecosystem and its underlying trends from a broader lens. Market Cap & ReturnsSource: datonomy™ The digital asset economy has evolved significantly since Bitcoin's inception in 2009, experiencing cycles of growth and change. Today, the ecosystem has matured considerably, and its future trajectory will be influenced by lessons learned from each passing cycle. The chart above illustrates these trends in Market Cap by asset class, labeled with major events that have shaped the market since 2020. What began as an system centered around digital currencies, has now expanded into a thriving ecosystem of blockchain infrastructure (smart-contract platforms, scaling and interoperability solutions) forming the foundational rails, on-chain derivatives (Stablecoins, tokenized assets) enabling efficient value transfer and a growing set of digital asset applications including Decentralized Finance (DeFi) and Non-Fungible tokens (NFTs). Currently, digital currencies dominate the market cap at 53.3%, followed by blockchain infrastructure at 31.8%. However, following a downturn in 2021, the influence of on-chain derivatives driven by the rise of stablecoins and digital asset applications has increased to 11.5% and 3.4% respectively. Source: datonomy™ Narrowing the timeframe to 2023 thus far, the relative size and % growth of certain sectors such as value transfer coins, stablecoins, smart-contract platforms, and information technology stand out from their respective asset classes. Despite the dominance of certain sectors, it’s clear to see that blockchain applications that sit atop smart contract platforms and scaling infrastructure are at a stage of relative infancy in comparison to more mature sectors. Sources: datonomy™ & Coin Metrics Reference Rates The chart above highlighting year-to-date returns shows superior performance of certain sectors in entirety, as well as within individual asset constituents that compose these sectors. The mean sector return can give us a better sense for relative performance, with the Information Technology sector leading the pack (89%), followed by Decentralized Finance (44%) and the Specialized Coins sector (37%). The presence of laggards have resulted in lower average returns for certain sectors, despite having constituents that have fared well. Sector CorrelationsExploring correlations provides insights into the complex relationship among digital asset sectors. Utilizing Coin Metrics' CMBI indexes, we can analyze the correlations between BTC and ETH (in green) and their respective sectors—value transfer and smart contract platforms (in red). As the two largest crypto-assets, BTC and ETH have generally exhibited a positive association, averaging between 0.85 and 0.65. Notably, their correlation peaked at 0.96 during the first week of 2023 fuelled by a marketwide rally and has since gradually declined below 0.80. The value transfer and smart contract platform sectors show a similar correlation pattern, albeit with more significant fluctuations influenced by other sector constituents. Currently, the sectors demonstrate a strong positive relationship with a correlation of 0.88. Source: Coin Metrics Correlation Charts The correlation between sectors of the same asset class can also reveal interesting associations. For example, the correlation between 'Value Transfer' and 'Specialized Coins' (including privacy and meme coins) within the Digital Currencies class has significantly dropped since early May 2023, nearing a low of 0.4. On the other hand, within the 'Blockchain Applications' class, the correlation between 'Decentralized Finance' and 'Metaverse' sectors has been rising steadily, reaching 0.95 since December 2021, from a typical range of 0.4 - 0.9. This reveals an interesting trend in behavior, showing a rising association between the two sectors during market downturns. Source: Coin Metrics Correlation Charts Sector VolatilityA challenging macroeconomic environment coupled with the scaling down of market making operations has led to a reduction in overall market liquidity. This is also reflected in the 30D volatility for BTC and ETH, descending to historically low levels at 0.016 and 0.019 respectively. Source: Coin Metrics Formula Builder Taking a step further, looking at volatility by asset sector can provide a more comprehensive understanding of the state of market volatility. Thus far in 2023, assets in the Decentralized Finance sector have displayed the highest average volatility, experiencing ~40% volatility during the time period. Likewise, the Business Services sector also showcases a high variance in volatility experienced by assets within the sector, displaying a similar overall volatility profile compared to tangential sectors within the Blockchain Applications asset class such Intermediated Finance and Information Technology. As expected, Stablecoins and Tokenized Assets exhibit the lowest volatility across all sectors barring USDC and DAI’s de-peg during the collapse of Silicon Valley Bank. Sources: Coin Metrics Reference Rates and datonomy™ Spot Volumes by Asset ClassSpot volumes across the major digital asset sectors also paint a similar picture. Along with subdued volatility and liquidity, spot volumes have also compressed to under $20B, from falling from $40B billion at the start of the year. As a result of this, On-Chain Derivatives and Digital Currencies which made up the lion's share of volumes in 2023 have reduced considerably. Source: datonomy™ ConclusionIn conclusion, despite currently facing depressed market conditions and a slew of both macroeconomic and regulatory challenges, the resilience of the digital asset markets remains remarkable. When examined through the lens of datonomy, it is evident that this ecosystem has weathered multiple stages of maturation, emerging stronger each time with expanding foundational infrastructure and applications. There are several reasons to remain optimistic—from the adoption of cutting-edge Layer-2 scaling solutions like Optimistic and Zk-Rollups to the growing prevalence of NFT marketplaces and Stablecoins, digital assets continue to push the boundaries of technological innovation. The ethos of the digital asset ecosystem continues to be embodied by the phrase—'bear markets are for building’. Network Data InsightsSummary MetricsSource: Coin Metrics Network Data Pro Active addresses on Bitcoin rose 10% to 894K per day over the week while Ethereum active addresses were 4% lower per day over the week. Activity on Ripple (XRP) surged, with active addresses rising 376% week-over-week to an average of 152K per day. This comes as a decision in the long-standing SEC lawsuit against Ripple appears to be drawing closer. Coin Metrics UpdatesThis week’s updates from the Coin Metrics team:
As always, if you have any feedback or requests please let us know here. Subscribe and Past IssuesCoin Metrics’ State of the Network, is an unbiased, weekly view of the crypto market informed by our own network (on-chain) and market data. If you'd like to get State of the Network in your inbox, please subscribe here. You can see previous issues of State of the Network here. © 2023 Coin Metrics Inc. All rights reserved. Redistribution is not permitted without consent. This newsletter does not constitute investment advice and is for informational purposes only and you should not make an investment decision on the basis of this information. The newsletter is provided “as is” and Coin Metrics will not be liable for any loss or damage resulting from information obtained from the newsletter. |
Older messages
Coin Metrics’ State of the Network: Issue 208
Tuesday, May 23, 2023
Tracking the Soaring Demand for Staking Ethereum
Coin Metrics’ State of the Network: Issue 207
Tuesday, May 16, 2023
Reviewing the liquidity landscape of the digital assets market
Coin Metrics’ State of the Network: Issue 206
Tuesday, May 9, 2023
Fee Market Mania Hits Bitcoin & Ethereum
Coin Metrics’ State of the Network: Issue 205
Tuesday, May 2, 2023
A data-driven update on MakerDAO & Dai
Coin Metrics’ State of the Network: Issue 204
Tuesday, April 25, 2023
Breaking down blockchain addresses
You Might Also Like
Central African Republic’s CAR memecoin raises scrutiny
Friday, February 14, 2025
Allegations of deepfake videos and opaque token distribution cast doubts on CAR's ambitious memecoin project. ͏ ͏ ͏ ͏ ͏ ͏ ͏ ͏ ͏ ͏ ͏ ͏ ͏ ͏ ͏ ͏ ͏ ͏ ͏ ͏ ͏ ͏ ͏ ͏ ͏ ͏ ͏ ͏ ͏ ͏ ͏ ͏ ͏ ͏ ͏ ͏ ͏ ͏ ͏ ͏ ͏ ͏ ͏ ͏
January CEX Data Report: Significant Declines in Trading Volume Across Major CEXs, Spot Down 25%, Derivatives Down…
Friday, February 14, 2025
According to data collected by the WuBlockchain team, spot trading volume on major central exchanges in January 2025 decreased by 25% compared to December 2024. ͏ ͏ ͏ ͏ ͏ ͏ ͏ ͏ ͏ ͏ ͏ ͏ ͏ ͏ ͏ ͏ ͏ ͏ ͏ ͏
Previewing Coinbase Q4 2024 Earnings
Friday, February 14, 2025
Estimating Coinbase's Transaction and Subscriptions & Services Revenue in Q4 2024 ͏ ͏ ͏ ͏ ͏ ͏ ͏ ͏ ͏ ͏ ͏ ͏ ͏ ͏ ͏ ͏ ͏ ͏ ͏ ͏ ͏ ͏ ͏ ͏ ͏ ͏ ͏ ͏ ͏ ͏ ͏ ͏ ͏ ͏ ͏ ͏ ͏ ͏ ͏ ͏ ͏ ͏ ͏ ͏ ͏ ͏ ͏ ͏ ͏ ͏ ͏ ͏ ͏ ͏ ͏ ͏
ADA outperforms Bitcoin as Grayscale seeks approval for first US Cardano ETF in SEC filing
Friday, February 14, 2025
Grayscale's Cardano ETF filing could reshape ADA's market position amid regulatory uncertainty ͏ ͏ ͏ ͏ ͏ ͏ ͏ ͏ ͏ ͏ ͏ ͏ ͏ ͏ ͏ ͏ ͏ ͏ ͏ ͏ ͏ ͏ ͏ ͏ ͏ ͏ ͏ ͏ ͏ ͏ ͏ ͏ ͏ ͏ ͏ ͏ ͏ ͏ ͏ ͏ ͏ ͏ ͏ ͏ ͏ ͏ ͏ ͏ ͏
AI project trading tips: investment targets and position management
Friday, February 14, 2025
This interview delves into the investment trends, market landscape, and future opportunities within AI Agent projects. ͏ ͏ ͏ ͏ ͏ ͏ ͏ ͏ ͏ ͏ ͏ ͏ ͏ ͏ ͏ ͏ ͏ ͏ ͏ ͏ ͏ ͏ ͏ ͏ ͏ ͏ ͏ ͏ ͏ ͏ ͏ ͏ ͏ ͏ ͏ ͏ ͏ ͏ ͏ ͏ ͏
DeFi & L1L2 Weekly — 📈 Polymarket recorded a new high of 462.6k active users in Jan despite volume dip; Holesky a…
Friday, February 14, 2025
Polymarket recorded a new high of 462600 active users in January despite volume dip; Holesky and Sepolia testnets are scheduled to fork in Feb and Mar for Ethereum's Pectra upgrade. ͏ ͏ ͏ ͏ ͏ ͏ ͏ ͏
Donald Trump taps crypto advocate a16z’s Brian Quintenz for CFTC leadership
Friday, February 14, 2025
Industry leaders back Brian Quintenz's nomination, highlighting his past efforts at the CFTC and potential to revamp crypto oversight. ͏ ͏ ͏ ͏ ͏ ͏ ͏ ͏ ͏ ͏ ͏ ͏ ͏ ͏ ͏ ͏ ͏ ͏ ͏ ͏ ͏ ͏ ͏ ͏ ͏ ͏ ͏ ͏ ͏ ͏ ͏
⚡10 Tips to Make a Living Selling Info Products
Friday, February 14, 2025
PLUS: the best links, events, and jokes of the week → ͏ ͏ ͏ ͏ ͏ ͏ ͏ ͏ ͏ ͏ ͏ ͏ ͏ ͏ ͏ ͏ ͏ ͏ ͏ ͏ ͏ ͏ ͏ ͏ ͏ ͏ ͏ ͏ ͏ ͏ ͏ ͏ ͏ ͏ ͏ ͏ ͏ ͏ ͏ ͏ ͏ ͏ ͏ ͏ ͏ ͏ ͏ ͏ ͏ ͏ ͏ ͏ ͏ ͏ ͏ ͏ ͏ ͏ ͏ ͏ ͏ ͏ ͏ ͏ ͏ ͏ ͏ ͏ ͏ ͏ ͏ ͏ ͏ ͏
Interview with CryptoD: How He Made $17 Million Profit on TRUMP Coin
Friday, February 14, 2025
Author | WUblockchain, Foresight News ͏ ͏ ͏ ͏ ͏ ͏ ͏ ͏ ͏ ͏ ͏ ͏ ͏ ͏ ͏ ͏ ͏ ͏ ͏ ͏ ͏ ͏ ͏ ͏ ͏ ͏ ͏ ͏ ͏ ͏ ͏ ͏ ͏ ͏ ͏ ͏ ͏ ͏ ͏ ͏ ͏ ͏ ͏ ͏ ͏ ͏ ͏ ͏ ͏ ͏ ͏ ͏ ͏ ͏ ͏ ͏ ͏ ͏ ͏ ͏ ͏ ͏ ͏ ͏ ͏ ͏ ͏ ͏ ͏ ͏ ͏ ͏ ͏ ͏ ͏ ͏ ͏ ͏ ͏ ͏ ͏ ͏

