The Election Bull Run From the Perspective of Options Markets
The Election Bull Run From the Perspective of Options MarketsAn analysis of options to take a closer look at the election bull-run that brought BTC prices to $85,000Get the best data-driven crypto insights and analysis every week: The Election Bull Run From the Perspective of Options MarketsBy: Victor Ramirez, Uriel Morone Key Takeaways:
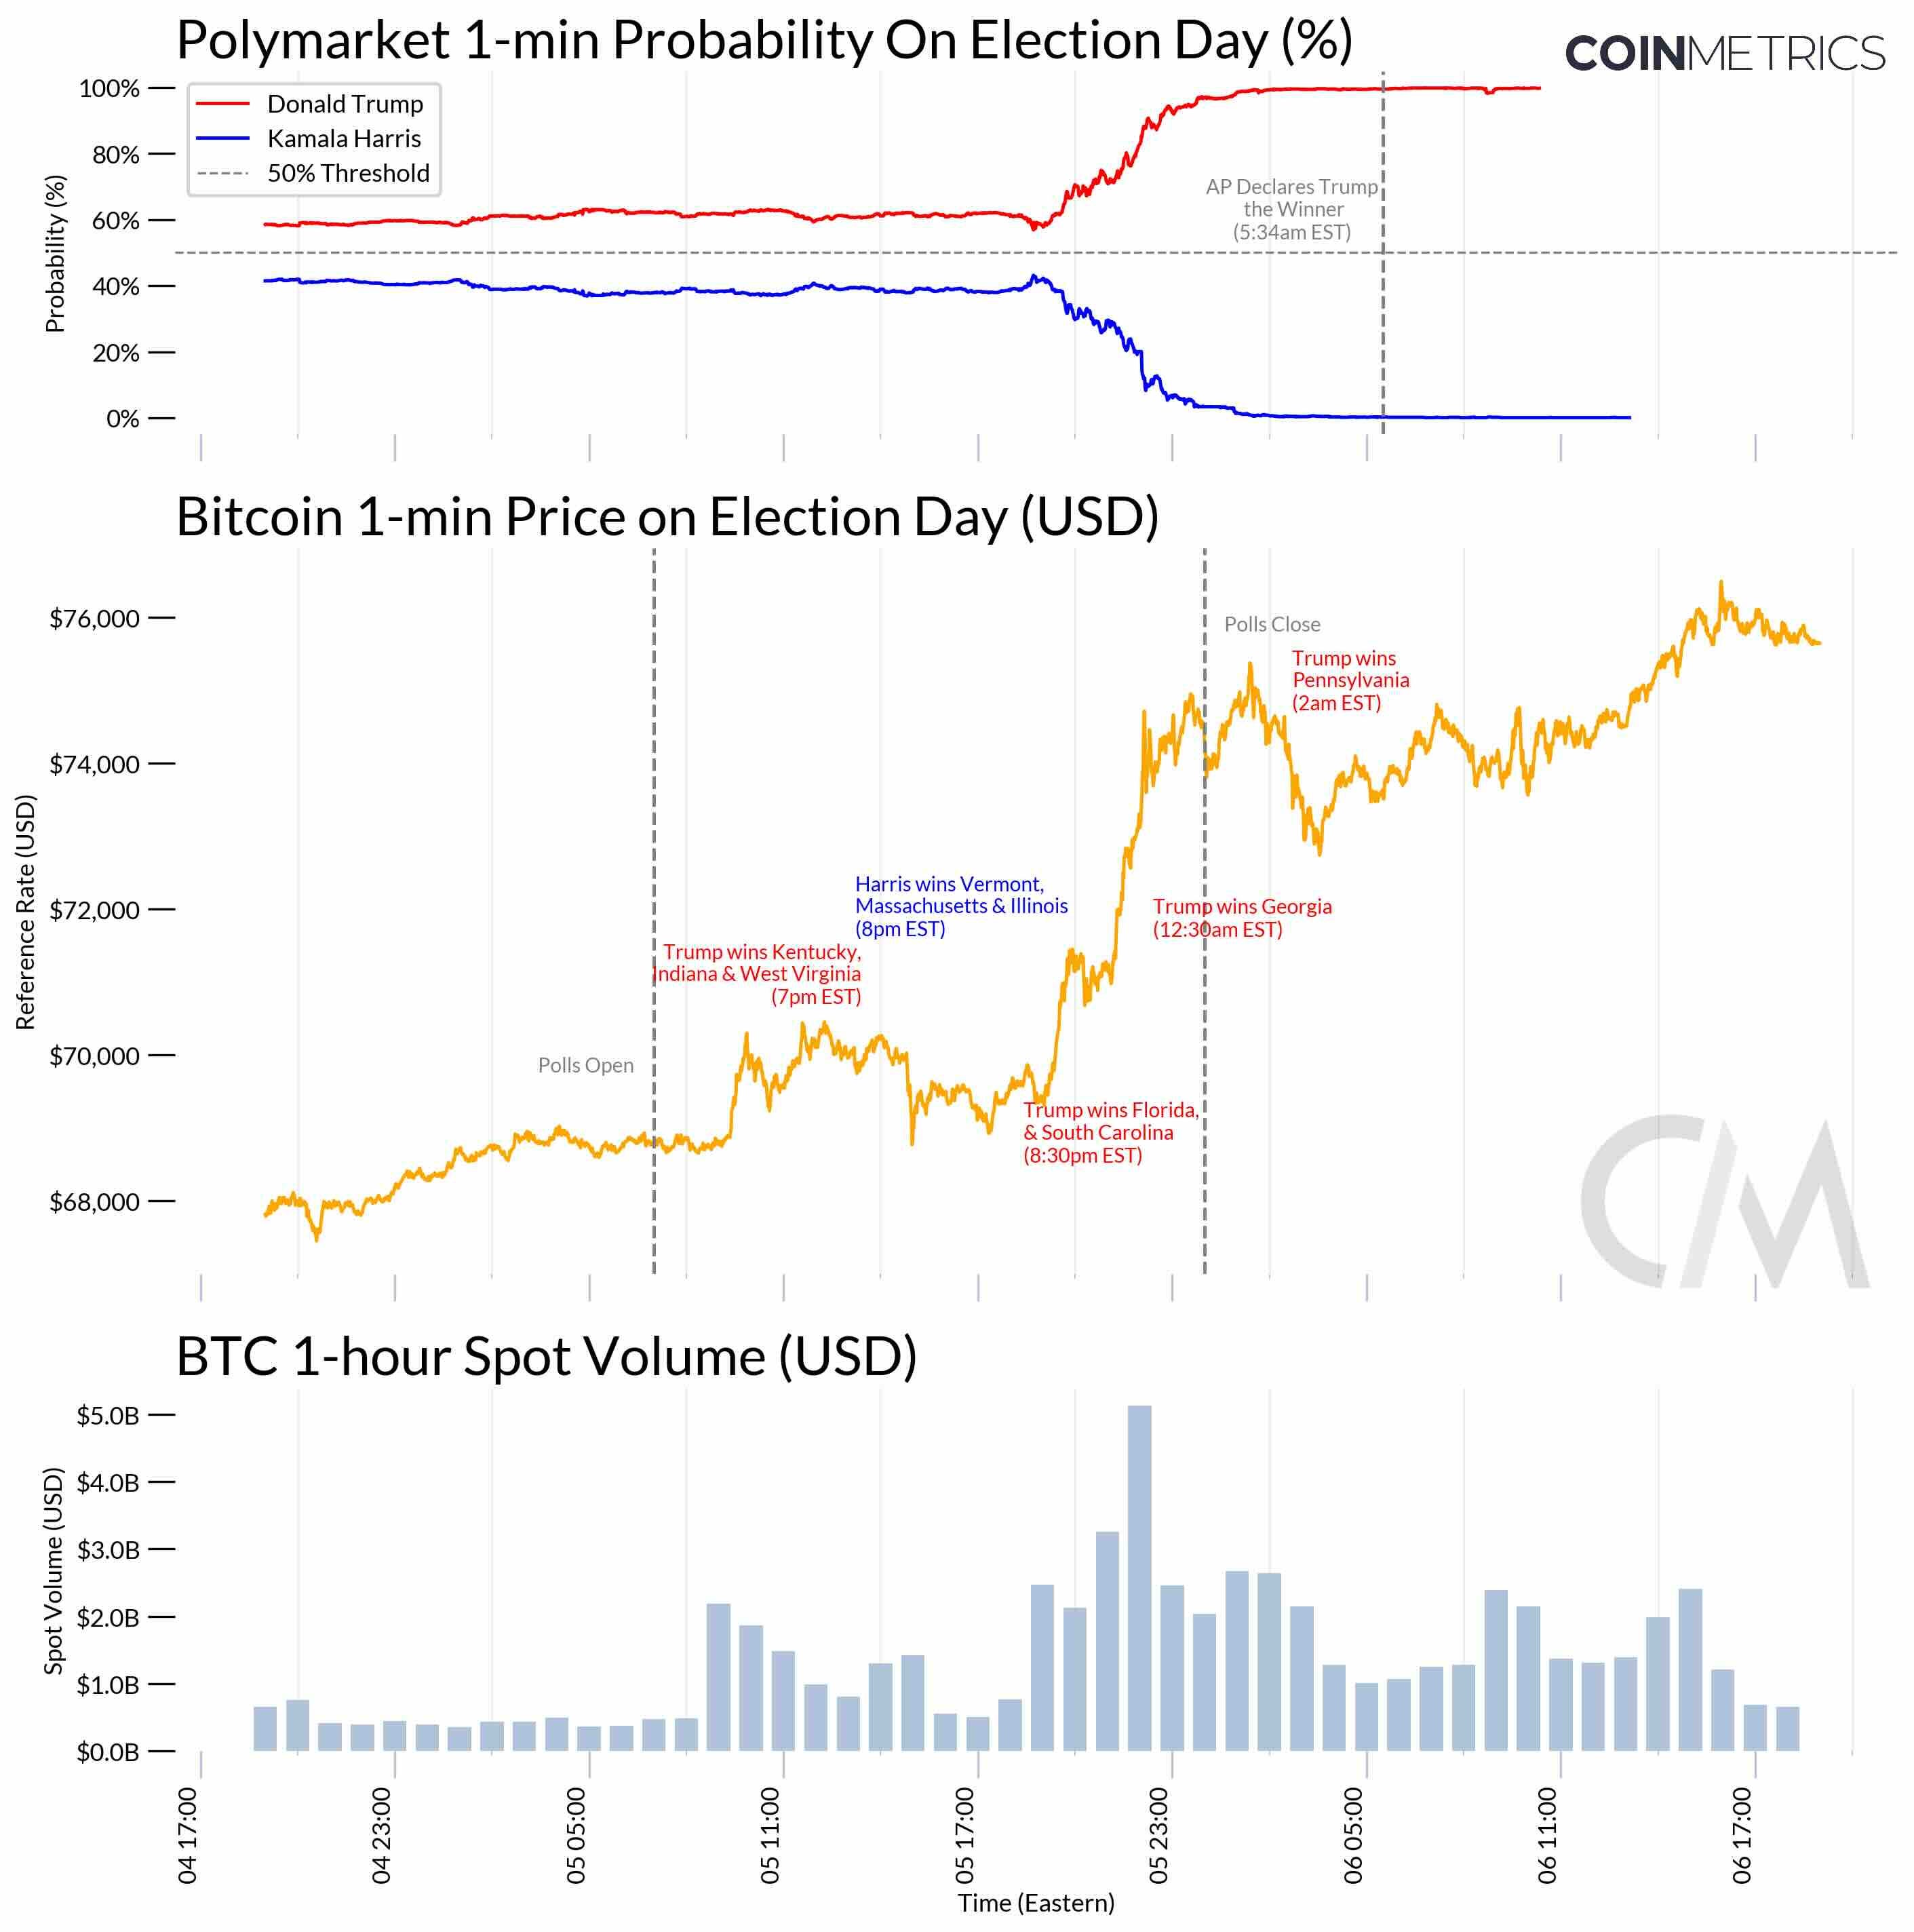
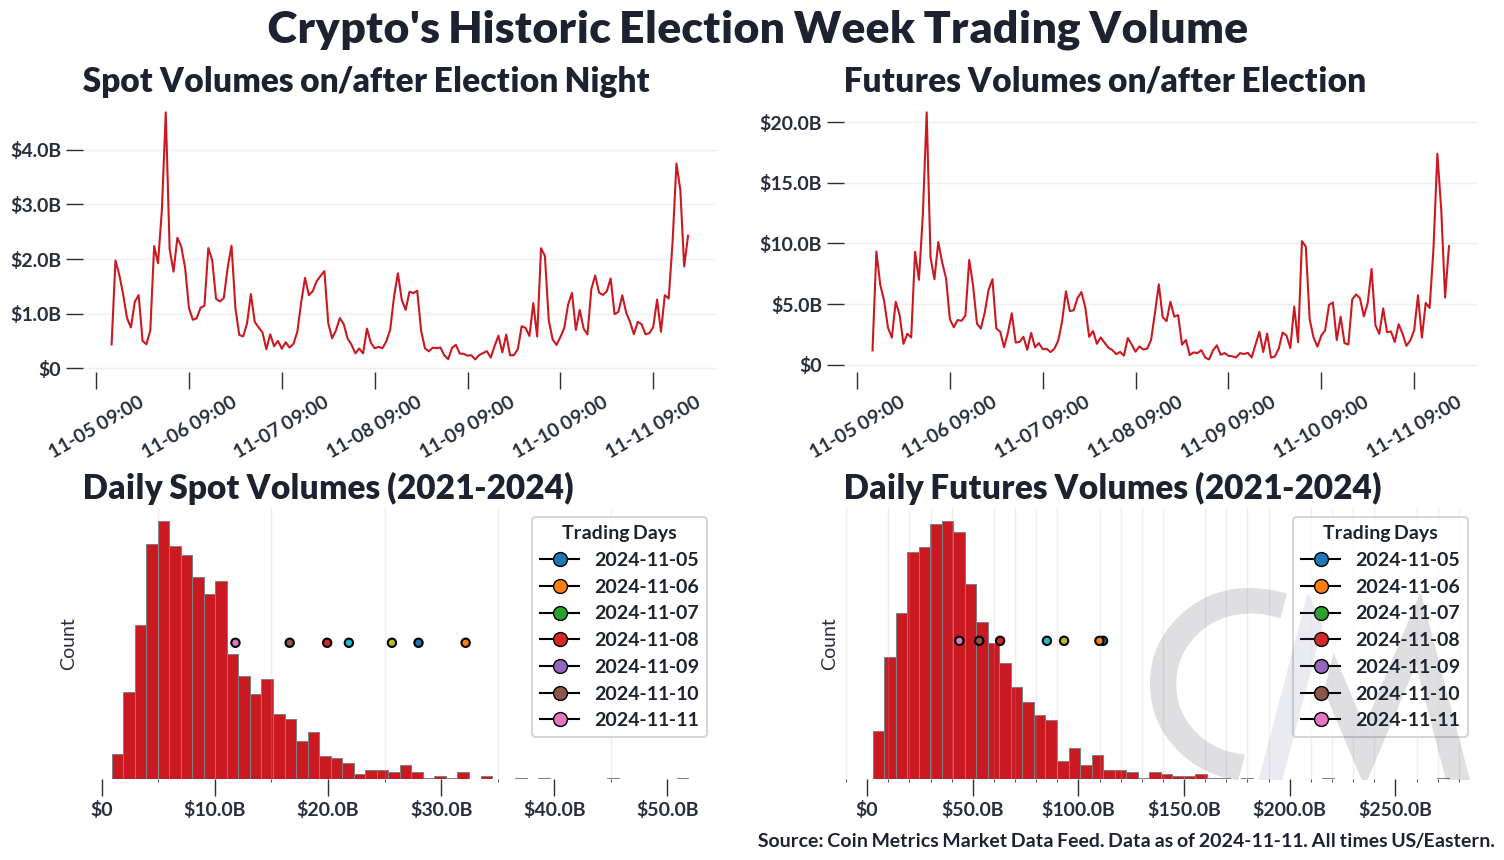
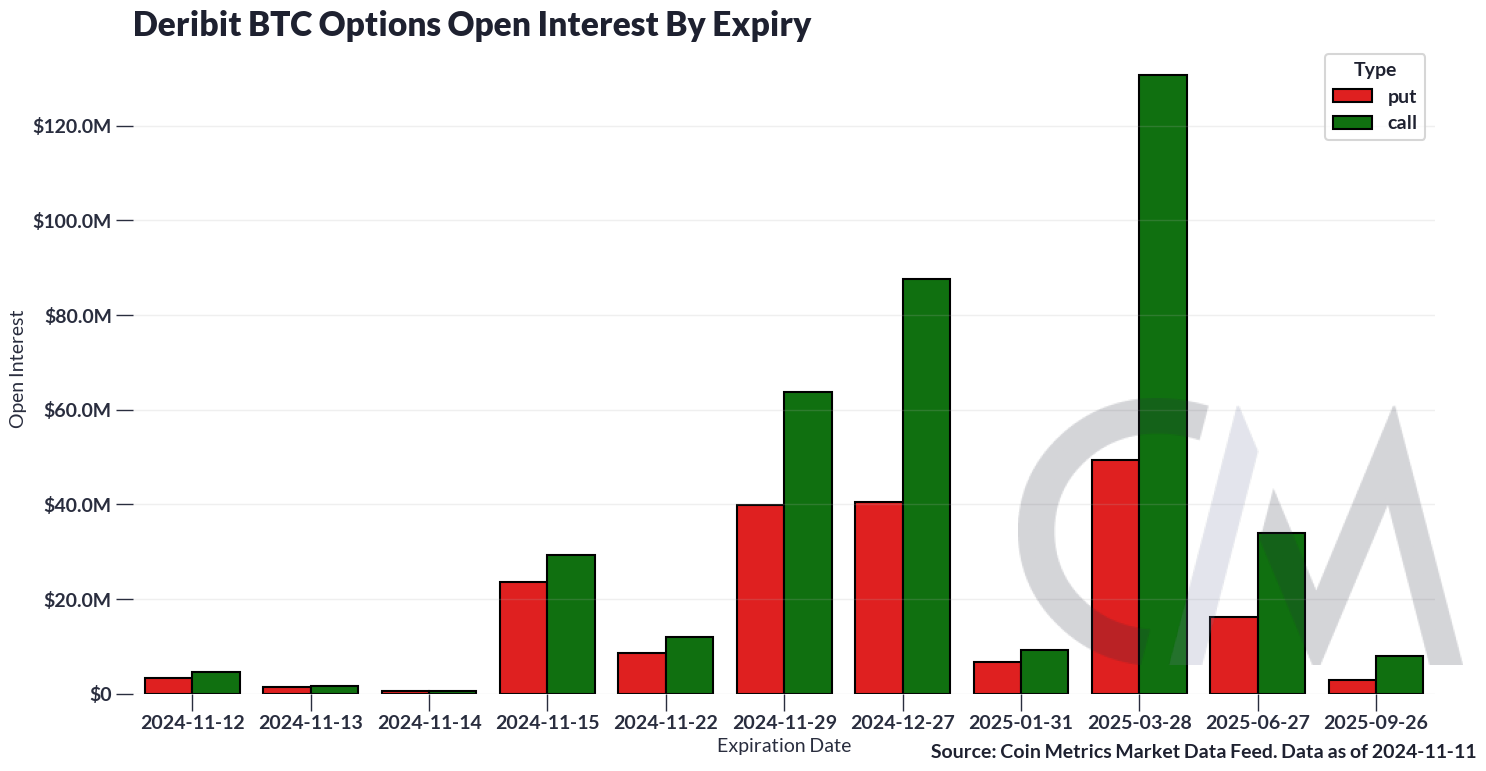
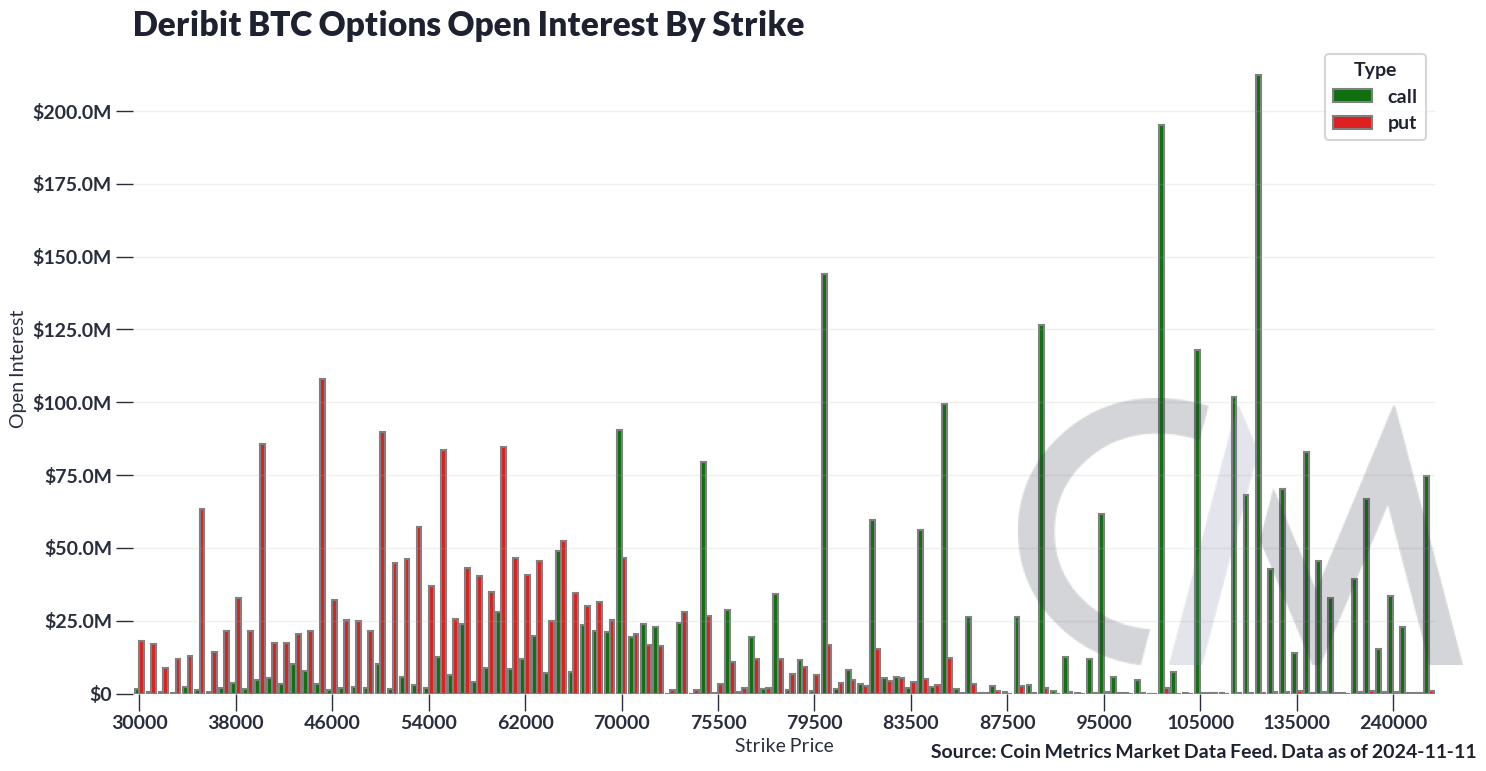
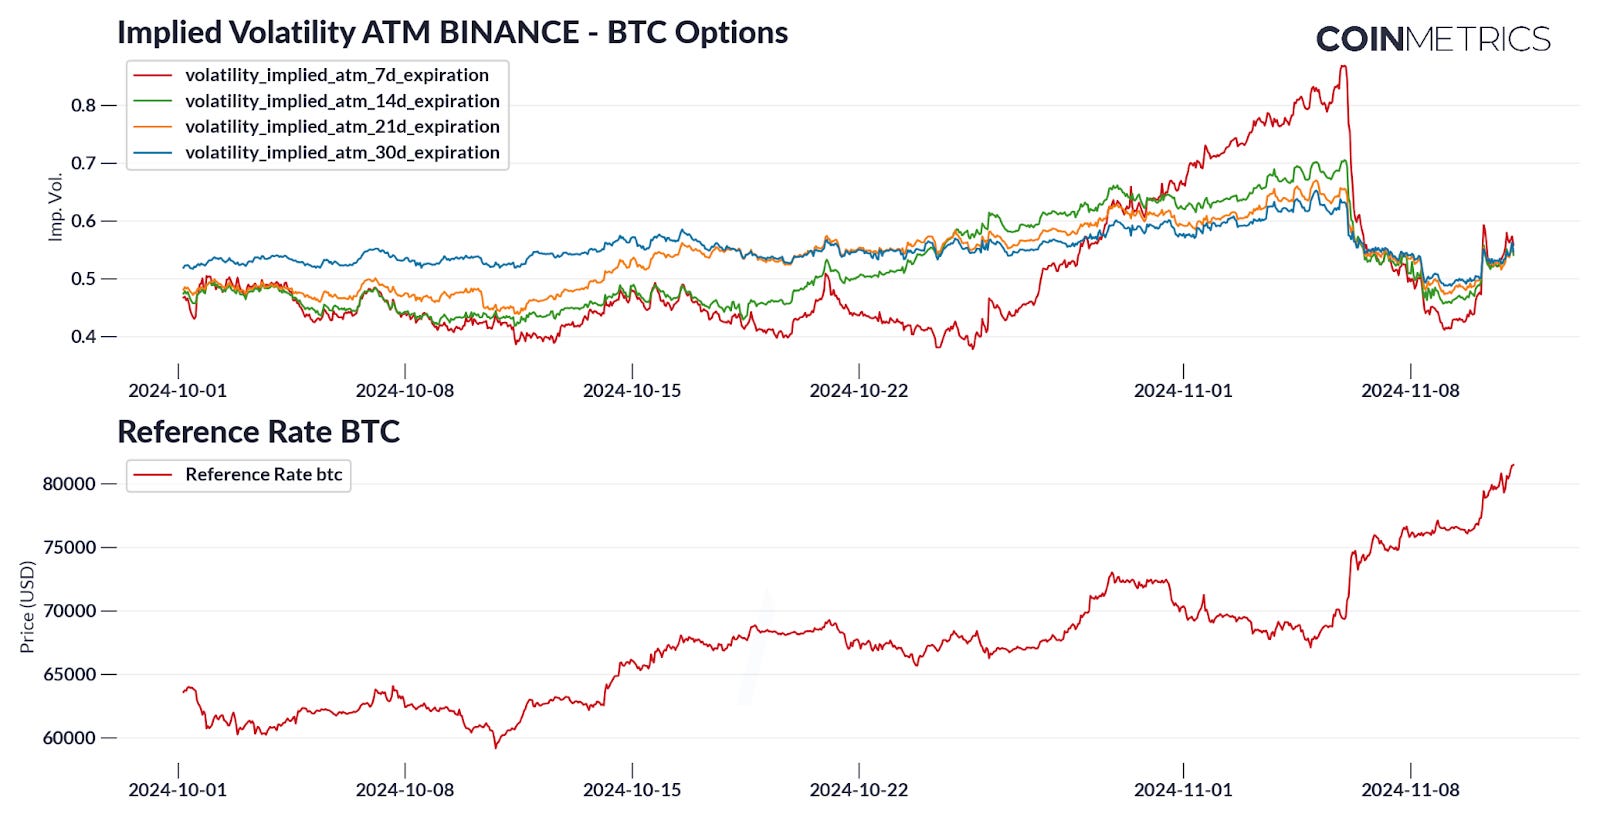
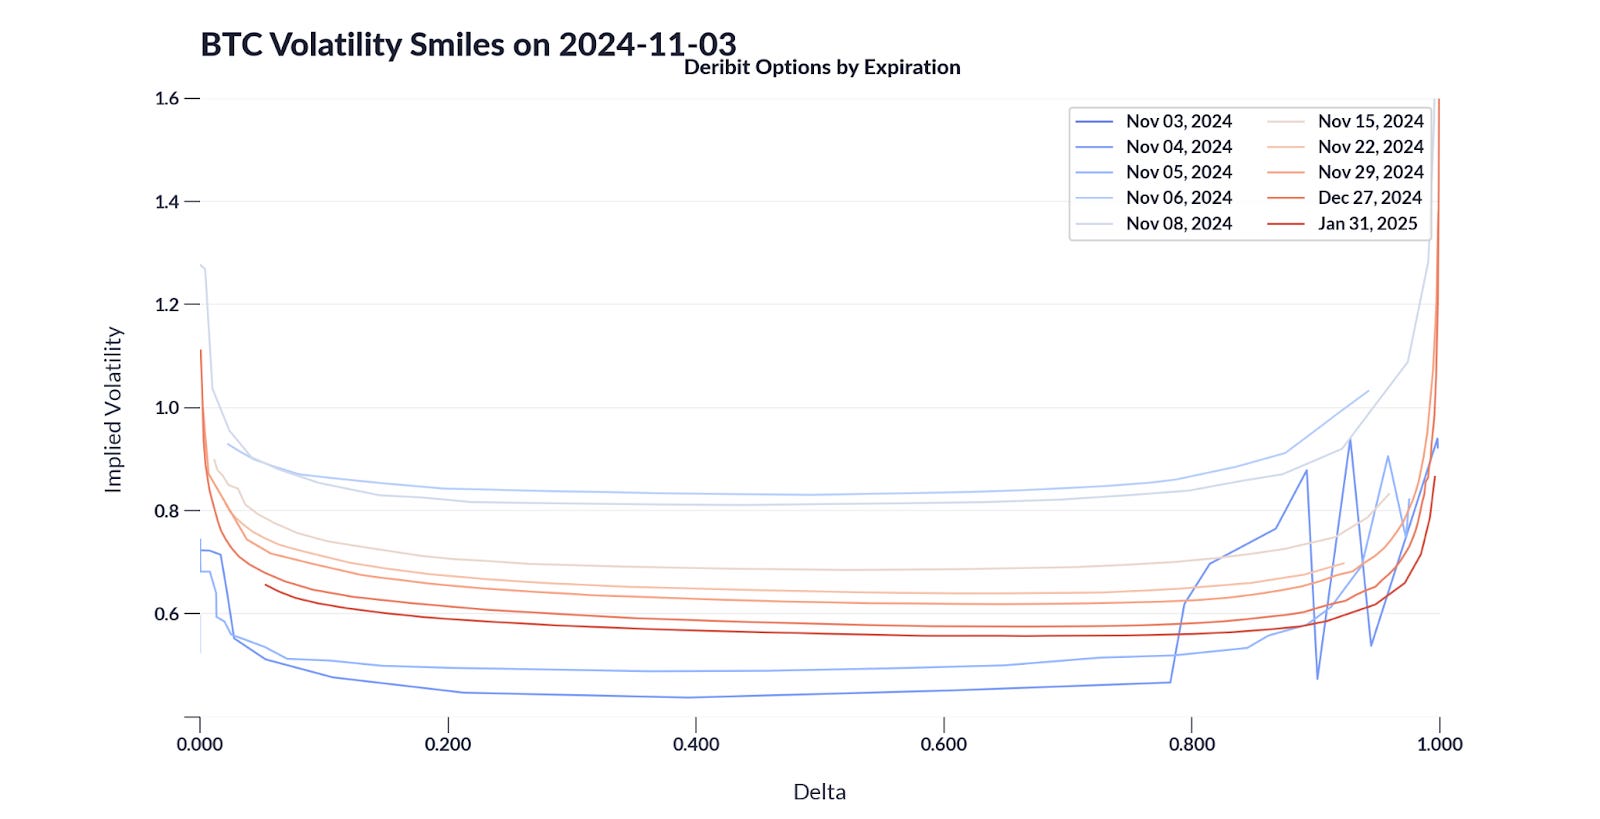
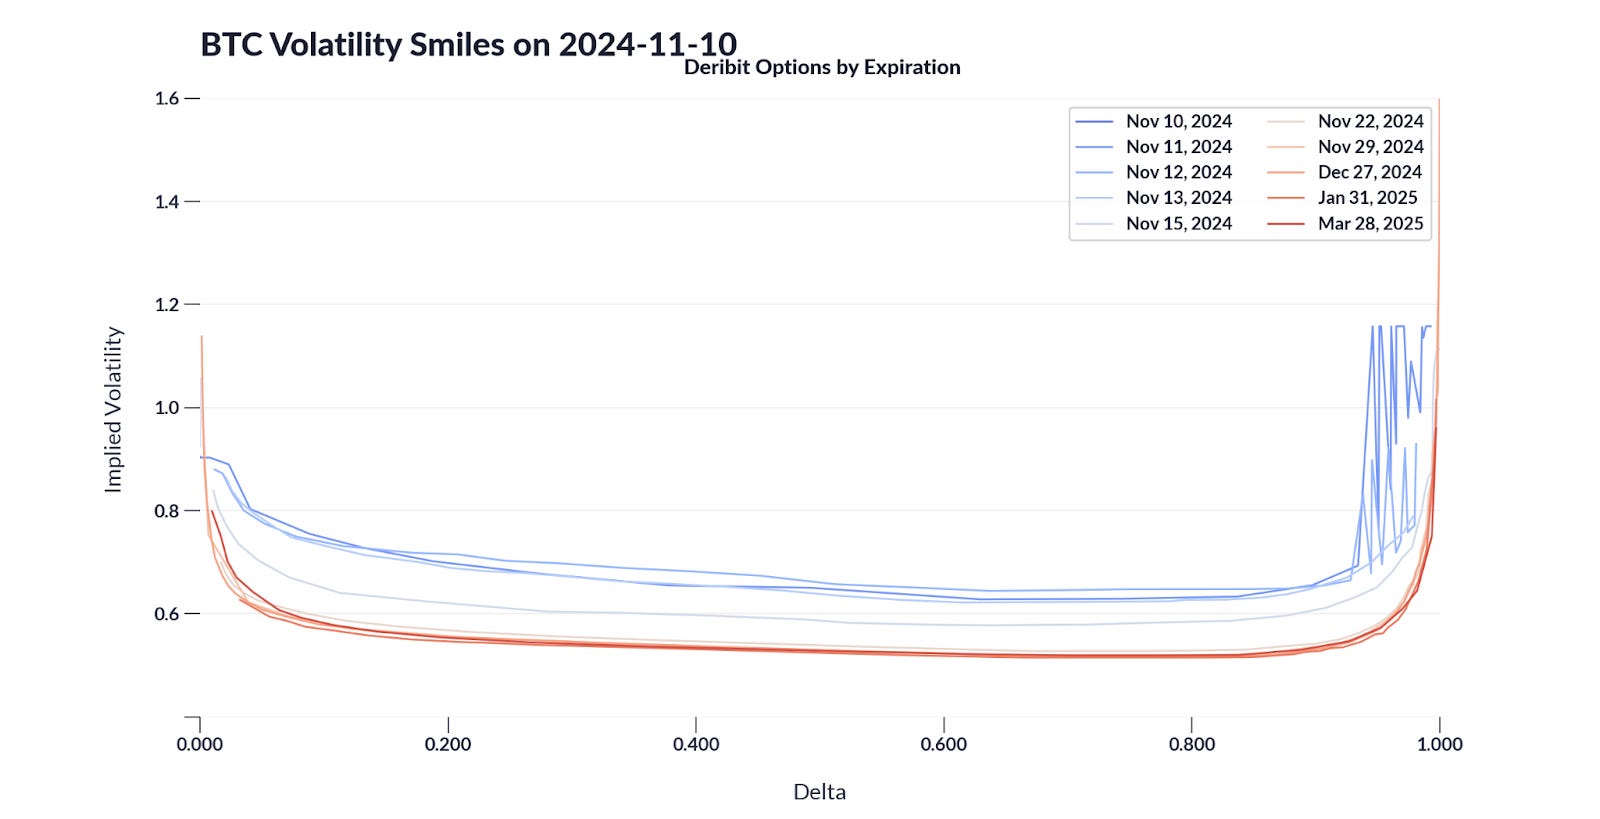
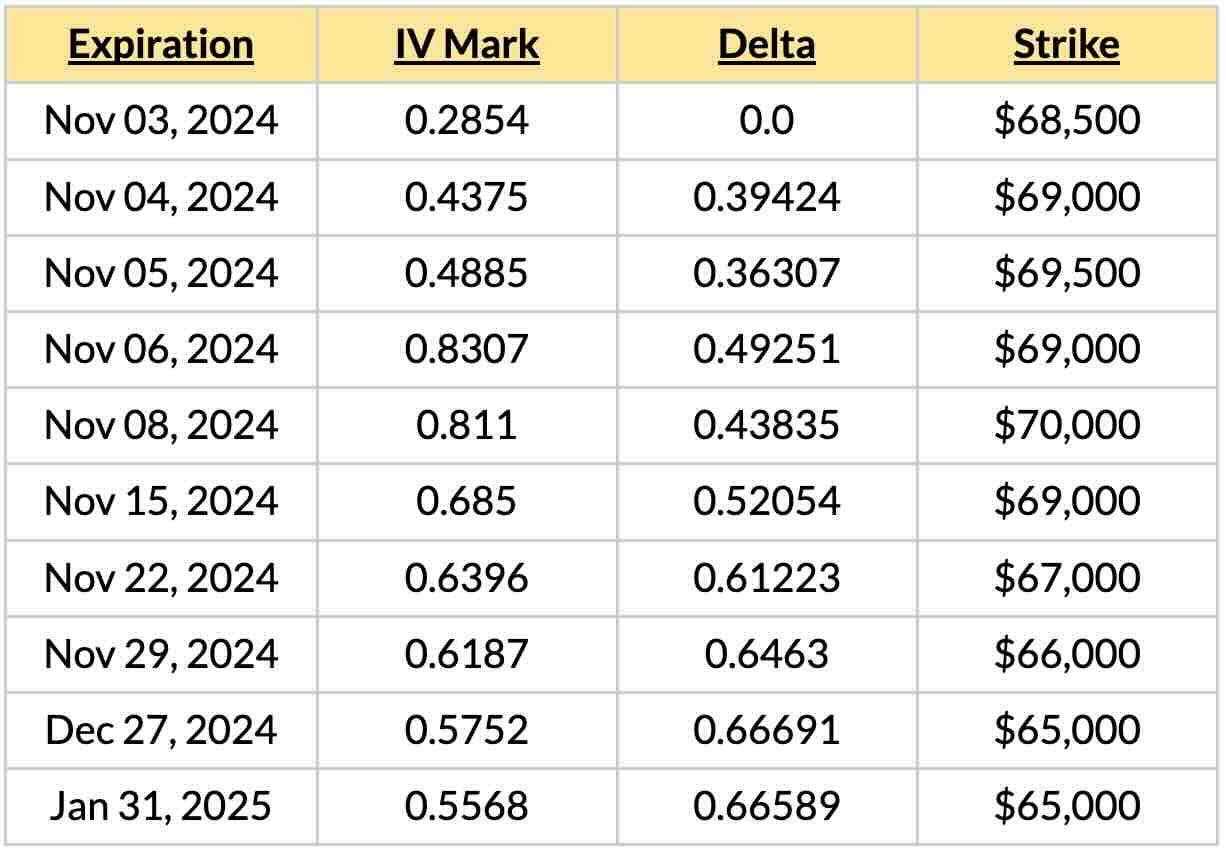
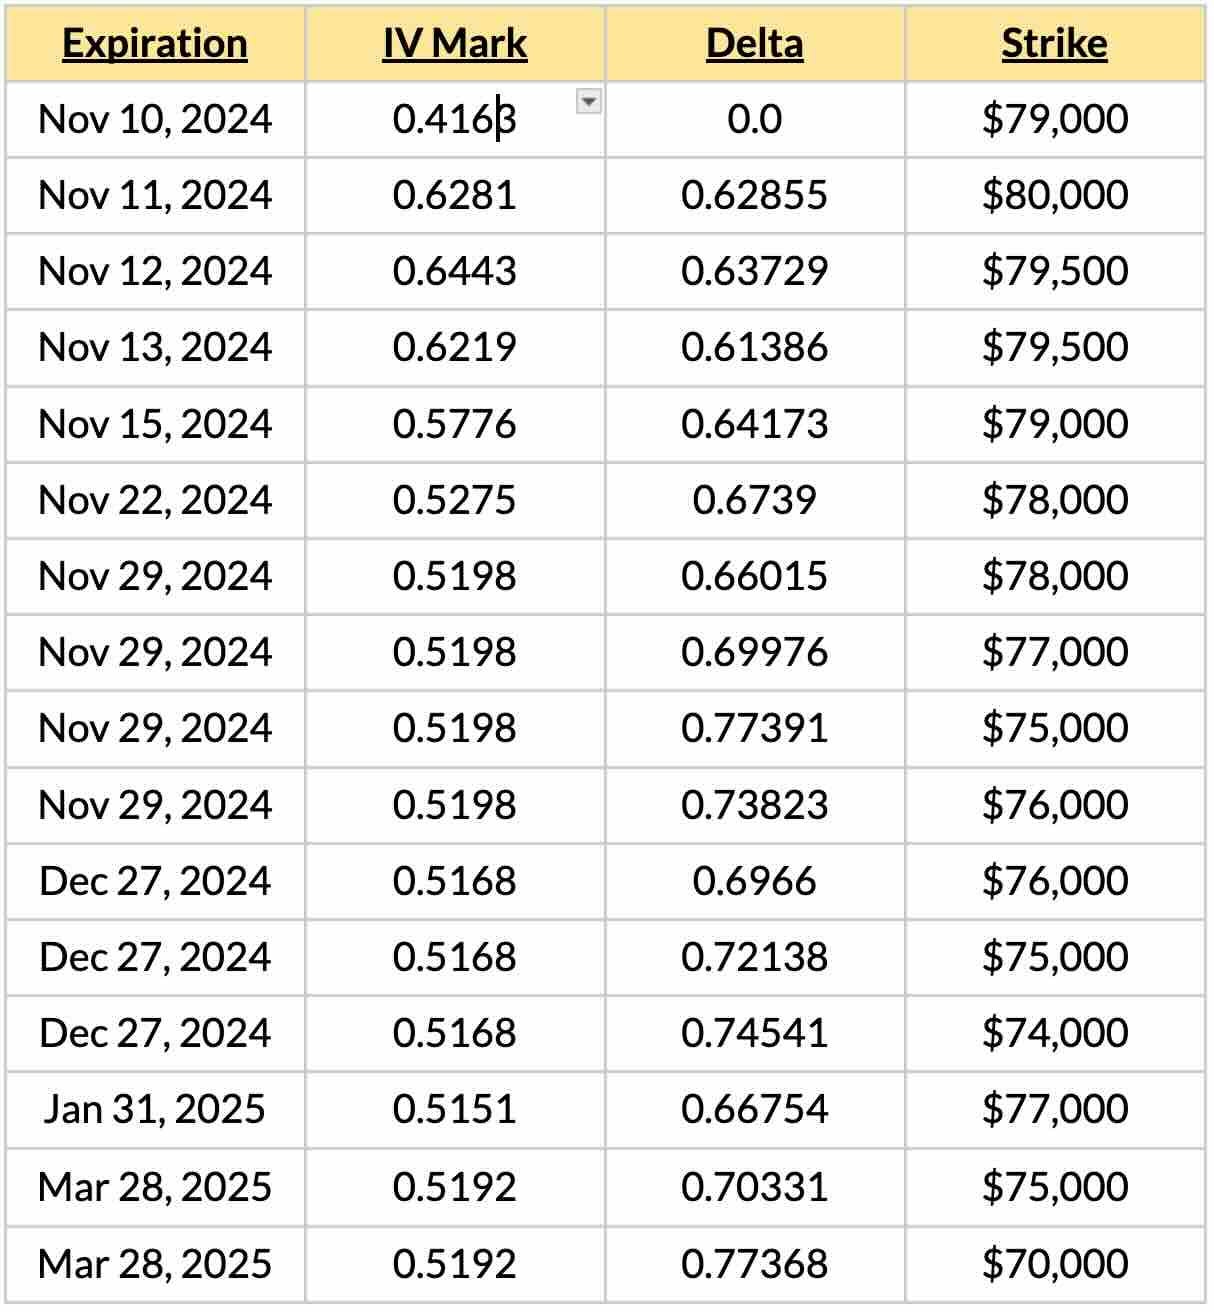
IntroductionThe 2024 US Election was a cathartic event for the crypto industry. Now two years since the FTX collapse, the industry has been targeted with intense scrutiny from financial regulators choking off access to banking for crypto businesses to regulatory agencies engaging in lawsuits that cost the industry nearly half a billion dollars so far to litigate. Dubbed the first “crypto election,” the 2024 cycle featured the first crypto lobby deploying more than $100 million in capital in several electoral races in the hopes of paving rules of the road for the industry. More candidates—including the presidential race—have adopted explicit stances crypto than any election before. Market participants have long awaited the resolution of this election to assess the regulatory risks of doing crypto in the US for 2024 and beyond. The hype did not disappoint. Bitcoin broke new all-time-highs on the back of historic trading activity. Since the election last week, Bitcoin has gained about $400 billion in marketcap in its ascend from $67k to almost $90k at the time of writing. But is this optimism the start of a new market regime or just a fleeting euphoria? In this week’s issue of Coin Metrics’ State of the Network, we’ll break down what went down in the markets around the election. We’ll also take a special look into how options markets are shaping up amidst a period of high levels of activity and uncertainty. [1) What] Happened in the Markets During the ElectionFor most of Election Day, markets were choppy, hovering between $68-70k as little was known about the outcome of the election. As evening dawned, election results started trickling in and a consensus began to form. Polymarket odds shifted for Donald Trump through most of the night and Bitcoin prices reflexively reacted to real-time information. By the following morning on 05:34am, the Associated Press had called the election for Trump, over 6 hours after Polymarket. Soon after the election was called, Bitcoin reached a then-all-time-high of $76,497. The power of 24/7 markets were on full display as the election unfolded. Source: https://x.com/coinmetrics/status/1854290564826468601 In a rare occurrence, volumes spiked considerably during US off-market hours, peaking at 10:00pm Eastern Time. For perspective, this was the ninth largest hourly spot volume and 26th largest hourly reported futures volume we’ve recorded to date. The charts on the bottom show how recent trading volume for Bitcoin compares historically. Trading activity every day since the election has been nothing short of extraordinary. Source: Coin Metrics Market Data Feed Options Markets Signal a Strong Bullish SentimentStudying options market activity can help us gauge market sentiment and expectations for future price movements. Options are complex derivatives, which can be used to get a sense of what the market collectively expects in terms of price movements. Options are contracts which give the owner of a contract the right to purchase (call) or sell (put) the underlying at the expiration date for a given strike price. This means the option’s owner will make a profit if the underlying asset’s market price is higher than the strike price at the expiration date if the option is a call option, or they will make a profit if the asset’s market price is lower in the case of a put option. Each option contract is defined by these three parameters: type (call/put), strike price, and expiration date. For a quick refresher on derivatives, check out our Mastering Derivatives piece and our options market tutorial. One of the main metrics used in options markets is open interest. Open interest, or the number of outstanding derivatives contracts, is a measure of market liquidity and sentiment. When both open interest and price are increasing, more traders are entering the market and signaling a strong conviction about the price movement of the market. The charts below show a breakdown of options market open interest by contract type. Source: Coin Metrics Market Data Feed Options open interest is skewed to have more call options than put options for contracts expiring from November 2024 and showing significant open interest at the $90-120k price level. This suggests that options traders believe that bitcoin is likely to increase to that level in the medium term and are positioning themselves to take advantage of potential price appreciation. Source: Coin Metrics Market Data Feed What Implied Volatility Can Tell Us About Market MovementsIn addition to a contract’s market price, options traders study its implied volatility (IV). Implied volatility is the percent of the current market price equal to one standard deviation in the price one year from now. IV is useful because in addition to being mappable to the contract’s price, it contains statistical information about the asset’s movements. If the open interest is the market’s expectation of the destination, volatility can tell us how we may get there. The value of the option is inherently probabilistic, meaning it is based on the likelihood the asset price will move by a certain amount in a certain time. Thus, it can be represented by a statistical parameter that captures the likelihood of this price movement. Traders will generally assume a certain model where the probability of the asset's future price depends on its volatility (in addition to the type, strike, and time until expiration). The IV is this variance of the asset’s price which is implied by the price the option is trading for on the current market. For example an IV=0.5 implies roughly a 68% likelihood the price in 1 year will be between 50–150% of today’s price. The greater the IV, the greater uncertainty there is about the price of the underlying asset. Lower IV values translate to greater confidence that the price will be near the asset price will be near the strike come the expiration date. Implied Volatility of Bitcoin Options Approaching and Proceeding the U.S. ElectionMarkets exhibited high levels of short-term volatility leading up the election. We can consider the IV of “short-term”[1] options expiring 1, 2, 3, and 7 days in the future, along with “medium-term” options expiring 7, 14, 21, and 30 days in the future. Source: Coin Metrics Market Data Feed We see clearly the impact of the election in a few different ways. First, the 1-day expiration option’s IV starts to increase rapidly about a day and a half before the election was resolved on November 6th at 1:00am. The 7d IV starts ramping up on Nov. 25th, the 14d IV on Nov. 19th, and the 21d IV on Nov. 12th. In each case the IV increases dramatically when the hypothetical expiration date of the options approaches the election day. This is not surprising if we consider what the IV represents: the amount of volatility or uncertainty in the BTC price. It stands to reason that the market expects a much wider range of potential prices after a major event. This range of potential outcomes is exactly what is represented by the IV, and what will determine the price of the option contracts. The impact of the election is even more obvious in both the drop and the consolidation of IV across all expiration dates immediately following Nov. 6th. The overall drop reflects a dramatic decrease in uncertainty. Similarly, the consolidation of the IV shows that the difference between expiration for an option that expires in 1 week and versus in 2 weeks, without an obvious catalyst, is less dramatic. Post-election we saw a sudden bull run around Nov. 10th. The IV jumps during this period, as it tends to do during significant price movements. However, it is also interesting to note the periods from Oct. 9–10 when—after falling since the election—the IV began creeping up again. This is notable because the price remained flat in this period. It appears the market began to get a sense that big moves were coming, despite the trading being sideways for several more hours. [1] In order to properly define “short-term” options, we must standardize the IV across time and price. Because the IV is a function of the time remaining until expiration, we would be interested in comparing a fixed time until expiration option over time, say options expiring in 7 days. However, if an exchange publishes options contracts expiring every Sunday, for example, we do not always have a 7-day window to consider. On Monday the contract will expire in 6 days, on Tuesday in 5 days, and so on. Similarly, the strike price matters mainly in relation to the current market price of the asset. If BTC was at $60,000 yesterday and $63,000 today, an option with a strike price of $60,000 will mean something very different than it did yesterday; it would be more accurate to compare today’s strike price of $63,000 to yesterday’s $60,000 option.We deal with this normalization problem by using Coin Metrics’ Implied Volatility ATM Fixed Term metrics. These metrics interpolate between real-world options to estimate the IV of an At-the-Money (ATM) option with a fixed time until expiration. ATM means the metric is derived from the IV of whichever option has a strike closest to the market price at the calculation time. Fixed-Term means that every time a value is calculated it considers a target expiration a fixed number of days ahead, and calculates a weighted average of IV of the options expiring closest to the target date before and after. This allows us to compare the IV on options over time in an apples-to-apples way.IV SmileThe curve below is referred to as the IV Smile, because IV tends to increase for strike prices far from the money (i.e., asset’s market price). However, the asymmetry or skew in this curve can show market sentiment about the expectation of an increase vs decrease in price. Although we can plot IV vs the Strike Price, it can give a clearer picture to look at the IV vs. delta of different options. Like the fixed-term options above, looking at delta in this way helps control for how far in the future the expiration date is. Delta is a “greek,” or derived value of the Black-Scholes option pricing model, which specifically says how much the option’s price changes relative to the underlying asset’s change in price. Delta can be seen as a way of looking at the strike price after controlling for the asset’s market price and how far in the future the option will expire. For call options a delta of 0.5 is usually at-the-money (strike = asset price at expiration date), a delta greater than 0.5 generally has a strike less than the asset price (ITM), and a delta less than 0.5 generally has a strike greater than the asset price (OOTM). Before Election (2024-10-03):Source: Coin Metrics Market Data Feed After Election (2024-10-10):Source: Coin Metrics Market Data Feed Initially, we see a notable pattern in the pre-election options, where the lowest implied volatilities (dark blue) were held by options expiring before the election, the second lowest by options expiring after in the future (dark red), and the largest volatility was in options expiring shortly after the election. It is interesting to observe that the market expects the price impact in the long term to somewhat balance out, however the period immediately following the election has the greatest uncertainty. The final note is difficult to observe directly in the graph, but using the data points we can identify which delta/strike represents the minimum of IV in for each expiration. The minimum IV is interesting, because we can say the market expects this price to be the “most likely”. This is a crude statement because several factors will influence the IV, not least supply and demand from traders hedging other positions that aren’t known. However, we can say holistically the market is pricing options as though there is the smallest uncertainty around this combination of price & expiration date. We will quickly note that the IV is rather flat, so “most likely” also does not mean “far and away the most probable.” The minimum IV values below were taken from the curves on Nov 3rd: We see that the options expiring before the election with the most stability have deltas less than 0.5. In other words, strike prices greater than the current market price of bitcoin. Meanwhile, the options expiring at the election (Nov. 6th) have a minimum IV when delta is almost exactly equal to 0.5, which can be seen as further confirmation this time frame is the one driving Bitcoin asset’s market price. Finally, the options expiring in the future had a lowest IV at a much larger value of delta, which may have been an indication the BTC price was expected to drop post-election. If we look at the more recent curves on Nov. 10th we see a different pattern in the minima: Note that some expirations have multiple minima, due to how flat the IV curve is. Now that the election has resolved, the IV across strikes are much more consistent. All the expiration dates have a minimum greater than 0.5, mostly clustered around 0.7. Again we see the market expects the least volatility at prices lower than the current market price (at the time). In fact, as we go further into the future we see that the minima of the IV shifts gradually to higher delta/lower strike price. Although we reiterate IV is quite close at different strike prices. ConclusionAmidst periods of high uncertainty, studying options markets can uncover how the market is weighing the likelihood of each outcome. With the US election finally in the rearview mirror, markets have responded with explosive optimism over the past week. In many ways, the recent market movements reflect the market pricing in the likelihood for a favorable regulatory environment for the US crypto industry in the foreseeable future. Regardless of who is in charge of any government in the world, blockchains remain a globally accessible, credibly neutral, and permissionless platform that anyone can use. Time will tell whether the market’s exuberance is just an irrational post-election honeymoon or the beginning of a new paradigm. But if the vibes now are indeed right, we may see greener pastures ahead for our fledgling industry. Coin Metrics UpdatesThis week’s updates from the Coin Metrics team:
© 2024 Coin Metrics Inc. All rights reserved. Redistribution is not permitted without consent. This newsletter does not constitute investment advice and is for informational purposes only and you should not make an investment decision on the basis of this information. The newsletter is provided “as is” and Coin Metrics will not be liable for any loss or damage resulting from information obtained from the newsletter. |
Older messages
Crypto Market & Polymarket Dynamics Heading into Elections
Tuesday, November 5, 2024
Coin Metrics' State of the Network: Issue 284 ͏ ͏ ͏ ͏ ͏ ͏ ͏ ͏ ͏ ͏ ͏ ͏ ͏ ͏ ͏ ͏ ͏ ͏ ͏ ͏ ͏ ͏ ͏ ͏ ͏ ͏ ͏ ͏ ͏ ͏ ͏ ͏ ͏ ͏ ͏ ͏ ͏ ͏ ͏ ͏ ͏ ͏ ͏ ͏ ͏ ͏ ͏ ͏ ͏ ͏ ͏ ͏ ͏ ͏ ͏ ͏ ͏ ͏ ͏ ͏ ͏ ͏ ͏ ͏ ͏ ͏ ͏ ͏ ͏ ͏ ͏ ͏ ͏ ͏ ͏ ͏
Polymarket and the Power of Collective Intelligence
Tuesday, October 29, 2024
Coin Metrics' State of the Network: Issue 283 ͏ ͏ ͏ ͏ ͏ ͏ ͏ ͏ ͏ ͏ ͏ ͏ ͏ ͏ ͏ ͏ ͏ ͏ ͏ ͏ ͏ ͏ ͏ ͏ ͏ ͏ ͏ ͏ ͏ ͏ ͏ ͏ ͏ ͏ ͏ ͏ ͏ ͏ ͏ ͏ ͏ ͏ ͏ ͏ ͏ ͏ ͏ ͏ ͏ ͏ ͏ ͏ ͏ ͏ ͏ ͏ ͏ ͏ ͏ ͏ ͏ ͏ ͏ ͏ ͏ ͏ ͏ ͏ ͏ ͏ ͏ ͏ ͏ ͏ ͏ ͏
Introducing Exchange Flow Metrics
Tuesday, October 22, 2024
New metrics tracking exchange-flows in BTC and ETH ͏ ͏ ͏ ͏ ͏ ͏ ͏ ͏ ͏ ͏ ͏ ͏ ͏ ͏ ͏ ͏ ͏ ͏ ͏ ͏ ͏ ͏ ͏ ͏ ͏ ͏ ͏ ͏ ͏ ͏ ͏ ͏ ͏ ͏ ͏ ͏ ͏ ͏ ͏ ͏ ͏ ͏ ͏ ͏ ͏ ͏ ͏ ͏ ͏ ͏ ͏ ͏ ͏ ͏ ͏ ͏ ͏ ͏ ͏ ͏ ͏ ͏ ͏ ͏ ͏ ͏ ͏ ͏ ͏ ͏ ͏ ͏ ͏ ͏ ͏
An Overview of the Flow Blockchain
Sunday, October 20, 2024
A data-driven overview of the Flow Blockchain ͏ ͏ ͏ ͏ ͏ ͏ ͏ ͏ ͏ ͏ ͏ ͏ ͏ ͏ ͏ ͏ ͏ ͏ ͏ ͏ ͏ ͏ ͏ ͏ ͏ ͏ ͏ ͏ ͏ ͏ ͏ ͏ ͏ ͏ ͏ ͏ ͏ ͏ ͏ ͏ ͏ ͏ ͏ ͏ ͏ ͏ ͏ ͏ ͏ ͏ ͏ ͏ ͏ ͏ ͏ ͏ ͏ ͏ ͏ ͏ ͏ ͏ ͏ ͏ ͏ ͏ ͏ ͏ ͏ ͏ ͏ ͏ ͏ ͏ ͏ ͏ ͏ ͏
State of the Network’s Q3 2024 Mining Data Special
Tuesday, October 8, 2024
Get the best data-driven crypto insights and analysis every week: ͏ ͏ ͏ ͏ ͏ ͏ ͏ ͏ ͏ ͏ ͏ ͏ ͏ ͏ ͏ ͏ ͏ ͏ ͏ ͏ ͏ ͏ ͏ ͏ ͏ ͏ ͏ ͏ ͏ ͏ ͏ ͏ ͏ ͏ ͏ ͏ ͏ ͏ ͏ ͏ ͏ ͏ ͏ ͏ ͏ ͏ ͏ ͏ ͏ ͏ ͏ ͏ ͏ ͏ ͏ ͏ ͏ ͏ ͏ ͏ ͏ ͏ ͏ ͏ ͏ ͏ ͏ ͏
You Might Also Like
Long term holders take profits as Bitcoin drops to $93k
Tuesday, November 26, 2024
Profit-taking trend emerges as Bitcoin flirts with six figures. ͏ ͏ ͏ ͏ ͏ ͏ ͏ ͏ ͏ ͏ ͏ ͏ ͏ ͏ ͏ ͏ ͏ ͏ ͏ ͏ ͏ ͏ ͏ ͏ ͏ ͏ ͏ ͏ ͏ ͏ ͏ ͏ ͏ ͏ ͏ ͏ ͏ ͏ ͏ ͏ ͏ ͏ ͏ ͏ ͏ ͏ ͏ ͏ ͏ ͏ ͏ ͏ ͏ ͏ ͏ ͏ ͏ ͏ ͏ ͏ ͏ ͏ ͏ ͏ ͏ ͏ ͏ ͏ ͏
MicroStrategy’s Bitcoin Mega Strategy
Tuesday, November 26, 2024
Analyzing MicroStrategy's Bitcoin holdings, acquisition strategy, and its role as a leveraged proxy to BTC. ͏ ͏ ͏ ͏ ͏ ͏ ͏ ͏ ͏ ͏ ͏ ͏ ͏ ͏ ͏ ͏ ͏ ͏ ͏ ͏ ͏ ͏ ͏ ͏ ͏ ͏ ͏ ͏ ͏ ͏ ͏ ͏ ͏ ͏ ͏ ͏ ͏ ͏ ͏ ͏ ͏ ͏ ͏ ͏ ͏
How did GMGN, a MEME tool with a daily revenue of over $700,000, succeed?
Tuesday, November 26, 2024
Recently, HAZE, a prominent trader known for grid trading, made headlines on Twitter as the “Meme Fool” after losing $350000 speculating on meme tokens. ͏ ͏ ͏ ͏ ͏ ͏ ͏ ͏ ͏ ͏ ͏ ͏ ͏ ͏ ͏ ͏ ͏ ͏ ͏ ͏ ͏ ͏ ͏ ͏
Bitcoin’s sudden dip under $95k incurs $180 million in trader losses, stalls $100k momentum
Monday, November 25, 2024
Turbulent hour for traders as Bitcoin slip below $95000 incites major liquidations for crypto traders. ͏ ͏ ͏ ͏ ͏ ͏ ͏ ͏ ͏ ͏ ͏ ͏ ͏ ͏ ͏ ͏ ͏ ͏ ͏ ͏ ͏ ͏ ͏ ͏ ͏ ͏ ͏ ͏ ͏ ͏ ͏ ͏ ͏ ͏ ͏ ͏ ͏ ͏ ͏ ͏ ͏ ͏ ͏ ͏ ͏ ͏ ͏ ͏ ͏
📈 BTC and ETH futures open interest on exchanges hit record-highs; Crypto.com acquired financial exchange and bro…
Monday, November 25, 2024
BTC and ETH futures open interest on exchanges hit record-highs; Crypto.com acquired brokerage firm Charterprime and extends its Visa card to Latin America; Options on US Bitcoin ETFs began trading. ͏
President Trump To Privately Meet With Coinbase CEO
Monday, November 25, 2024
We bring you the top stories in crypto every week! Stories like... Monday Nov 25, 2024 Sign Up Your Weekly Update On All Things Crypto TL;DR Welcome to this week's edition of CryptoWeekly Recap,
Mingdao: Transforming Illusions into Reality - Discussing MicroStrategy's Grand Strategy
Monday, November 25, 2024
MicroStrategy has truly hatched the biggest golden egg in this crypto cycle, with paper profits exceeding $15 billion in less than two years. ͏ ͏ ͏ ͏ ͏ ͏ ͏ ͏ ͏ ͏ ͏ ͏ ͏ ͏ ͏ ͏ ͏ ͏ ͏ ͏ ͏ ͏ ͏ ͏ ͏ ͏ ͏ ͏ ͏ ͏
Finish signing in to Crypto.com DeFi Research
Monday, November 25, 2024
Here's a link to sign in to Crypto.com DeFi Research. This link can only be used once and expires in one hour. If expired, please try signing in again here. Sign in now © 2024 Crypto.com 1
Polymarket: A revolution in prediction markets
Sunday, November 24, 2024
CryptoSlate's latest report explores Polymarket's evolution, its role in high-stakes prediction events like US elections, and the impact of its controversies on its market position. ͏ ͏ ͏ ͏ ͏ ͏
Asia's weekly TOP10 crypto news (Nov 18 to Nov 24)
Sunday, November 24, 2024
The Japanese government has announced plans to advance a new economic stimulus package, expected to receive approval by the end of 2024. ͏ ͏ ͏ ͏ ͏ ͏ ͏ ͏ ͏ ͏ ͏ ͏ ͏ ͏ ͏ ͏ ͏ ͏ ͏ ͏ ͏ ͏ ͏ ͏ ͏ ͏ ͏ ͏ ͏ ͏ ͏ ͏

